

February 1, 2007
By Barb Schmitz
Members of the BMW Oracle Racing design team share a common, single goal: to design the International Americas Cup Class (IACC) yacht that will win back the America’s Cup in 2007 in Valencia, Spain. Yacht design has always involved leveraging leading-edge technologies with much of the highly specialized research work being outsourced. BMW Oracle Racing, representing San Francisco’s Golden Gate Yacht Club,however, has taken a very different tack: It is doing as much of the research as possible in-house and one area of design that has remained almost entirely in-house is CFD.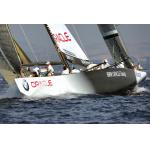 Hull design is everything. Two CFD methods are being used by BMW Oracle to fine-tune the US boat. Photo by Gilles Martin-Raget. Hull design is everything. Two CFD methods are being used by BMW Oracle to fine-tune the US boat. Photo by Gilles Martin-Raget. |
Viscous, free-surface, and lifting surface effects all play critical roles in sailing yacht design. While CFD has always pushed existing technologies to the limit, the large number of requirements placed upon sailing yacht design complicates how you use CFD technology. For example, to win the America’s Cup, a yacht has to sail efficiently at all speeds up to 18 knots and at all heel angles up to 35 degrees. A yacht must sail into the wind, requiring lift-to-drag ratios in excess of 5.0 for the hull, yet it also must be able to sail away from the wind with near-zero lift requirements.
To win, you have to be able to handle all these conditions more efficiently than your opponents. To analyze all these conditions for all possible design variations using the most complex analysis procedures available within the timeframe of an IACC design cycle is an early impossible engineering task.
To cover the design space with the greatest efficiency requires investment of design resources into different CFD methods, which is why BMW Oracle Racing has invested heavily in two CFD methods: finite volume prediction methods and boundary element methods. Calculation speed and physical detail variations in the methods mean that comparing the results of both bring greater insight than one alone.
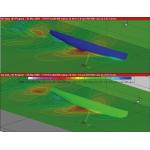 Figure 1: The results of refining the grid for a boundary element code. Figure 1: The results of refining the grid for a boundary element code. |
Taking the Right Tack to Better Hull Design
Jonathan Binns, PhD, a CFD and experimental operator with the BMW oracle design team, says that the design team performed CFD analyses using three finite volume codes from CD-Adapco and ANSYS and six boundary element codes from a variety of sources ranging from XFoil to custom-built programs. Each code offers advantages in terms of throughput, physical simulation detail, and pre- and postprocessing requirements. However, at some stage, all the results must be related to each other and then ultimately to the design of the yacht.
“This is where Tecplot has become important to our research effort in providing a universal format with a high degree of programmability,“says Binns. “Tecplot has provided the visualization link required for many situations.”
The graphics of refined grids in Figures 1 and 2 (above) and 3 (below)show the results of refining the grid for a boundary element code. The top image shows the dynamic pressure distribution for the older grid,the bottom shows the dynamic pressure for a refined grid. “These images provide information to the CFD researchers concerning the improvements made and visual proof to the designers that the results will provide a better answer,” says Binns.
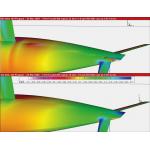
| Figure 3: Dynamic pressure coefficient for appendage predictions show the effect of grid refinement on the bulb-wing interface. The top image is prior to grid refinement, the bottom is post refinement. |
The resulting plot shows the predicted variation in dynamic pressure coefficient for an IACC yacht sailing to windward. What Binns and the BMW Oracle design team learned from the results was that the refined grid and the newer program were producing a much smoother, more realistic pressure distribution. “Spikes in the pressure distribution have been dramatically reduced and so the results can be used with much greater confidence for subtle design geometry changes in these regions,” says Binns.
The graphics of the finite volume results (right image of Figure 4,below) against the boundary element results (left image of Figure 4,below) provide much greater understanding of the effects of the differences between the two CFD methods. “Armed with this information our CFD operators can better provide our designers with the information they need in the timeframe they need it.”
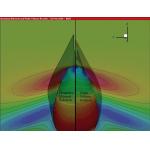
| Figure 4: The dynamic pressure coefficient on the hull and wave surface elevation on the free surface. The left-hand side shows results from boundary element predictions, the right-hand side shows results from finite volume predictions. |
The plot was created using data generated by a boundary element time domain flow solver and an unsteady finite volume solver. To create the plot, Binns exported the final ten steps of a converged solution from the flow solver to an ASCII data file, and then imported those steps into Tecplot using a customized add-in he wrote to average the final ten steps. The layouts were then linked to ensure that they could be examined from an identical angle and location.
Visualizing a Winning Design
Besides pressure distributions, the design team also uses Tecplot to visualize sheer stress distributions for CFD data and for plotting large sets of X,Y data from experiments. “Tecplot also gives us the ability to easily plot and print multiple data sets of 4 million or more datapoints with overlays and graphics,” adds Binns.
The results of these visualizations are used to explore design spaces as large as possible and to gain a greater insight into flow topology.“In this way,” says Binns, “small incremental advancements can be made to produce greater lift for lower drag while sailing. Experimental data is used hand-in-hand with CFD results both as validation and as design insight.”
Visualizing the data with Tecplot not only provides the design team with a way to view physical representations of its CFD analyses, but also provides valuable design information on the effects of design variations.
Binns says that Tecplot’s three greatest strengths are its Macro and ADK (add-on developer’s kit) programming, its ability to handle very large data sets, and its common data format. Without Tecplot, Binns says that customized comparisons would not be possible, which might leave his dream of being a part of an America’s Cup winning yacht design team high and dry.
Barb Schmitz is a freelance technical writer and public relations consultant with more than 10 years of experience working as an editorfor a technical trade magazine. She has written extensively on a wide range of design engineering topics. Send your comments about this article through e-mail by clicking here. Please reference “Different Tack for CFD” in your message.
Canonsburg, PA
Melville, NY & London, UK
Bellevue, WA
Subscribe to our FREE magazine, FREE email newsletters or both!
About the Author
DE’s editors contribute news and new product announcements to Digital Engineering.
Press releases may be sent to them via [email protected].


