

July 1, 2011
By Vince Adams
In the data-driven worlds of research and engineering, more truly is better. OriginPro 8.5.1, released in April, “provides tools for serious data analysis, such as Peak Fitting, Surface Fitting, Statistics, Signal Processing, and Image Handling,” says Joe Przechocki, business development manager of OriginLab Corp., Northampton, MA.
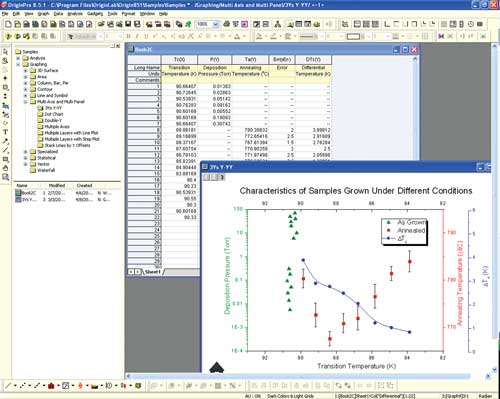
Figure 1: The OriginPro User Interface.
Origin began in the early 1990s as a utility for processing data from microcalorimeters from MicroCal Corp. (now part of GE Healthcare). Its beginnings focused the product on publication-quality graphing and easy-to-use curve-fitting for Windows users. MicroCal quickly recognized its value and flexibility early on, and a new company called MicroCal Software was developed for the sole purpose of developing Origin for wider applications. In 2000, the company changed its name to be more in line with its popular product name. OriginLab Corp. was born.
In a nutshell, Origin, the base version, and OriginPro, with extended functionality, provide point-and-click control over every element of a plot. Additionally, users can create multiple types of richly formatted plots, perform data analysis and then embed both graphs and results into dynamically updated report templates for efficient re-use of effort.
“At a conference, you can tell right away who’s using a graphics program like OriginPro and who’s not,” notes Jeff Thompson, a research scientist at the Energy & Environmental Research Center in Fargo, ND. He frequently acquires data in relatively short-duration projects that needs to be analyzed, then published or presented. The “polish” and personalization he can add to a report drew him to Origin Pro, he says.
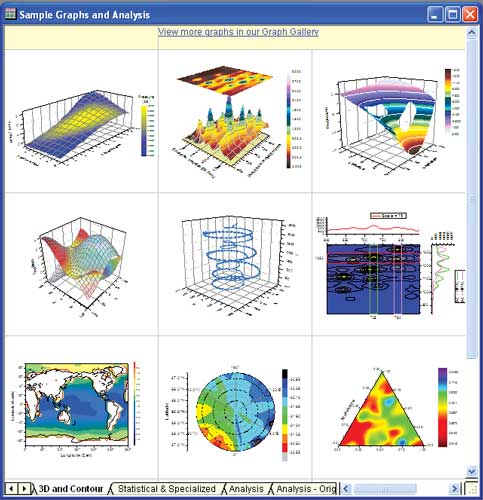
Figure 2: The OriginPro Graph Gallery.
All data, plot types and settings are saved in a single project file (called an OPJ file), so organizing, archiving and sharing is practically painless. Furthermore, OriginLab offers a free Origin Project Reader so that any colleague “or customer “can access OriginPro data without a copy of the software installed. This can be downloaded from OriginLab.com.
The User Interface
As shown in Figure 1, OriginPro is toolbar-driven with two primary sections: the Project Explorer, on the left, and the working or active window. The Project Explorer has a familiar-looking folder structure. Because the project is stored in a single file, each user-created folder represents a section of the data to make access more logical and organized. The list below the folder tree reflects the contents of the selected folder, including data tables and plots.
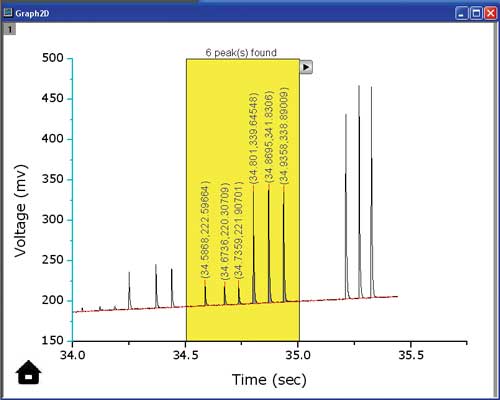
Figure 3: The Region of Interest (ROI) of the Quick Peaks Gadget.
To make changes in a graph, a user navigates to the folder containing the graph, then double-clicks on any part of the graph to get a dialog box. This is where the years of product refinement show: Almost any conceivable change to the graph is possible with the dialog boxes provided “no special coding or programming knowledge is required.
Case in Point Jeffrey Hurlbut is a research Fellow at Solutia, Inc., a developer of specialty products such as the material used to prevent shattering on most automobile windshields. He has been using OriginPro for about 10 years, and says he was drawn to it as much for the data analysis tools as the data formatting capabilities. “Regular tasks, such as finding the area under a curve, are much easier than in common spreadsheet applications,” he says. “The Gadgets introduced in 8.5.1 are fantastic. I can quickly drag a selection around a curve with immediate feedback on the region of interest. I’m able to examine data and trends that I might otherwise have overlooked with more complicated methods.” Hurlbut also points to OriginLab’s strong support network: “OriginLab has even written custom applications for Solutia, and provided live update training for the 10 or so users at our facility.” |
As with many full-featured software products, the number of options and controls can be daunting. To reduce the learning curve, both after extended periods away or when venturing into new graph or report types, OriginPro offers a number of aids, both in the software and on its website.
The Help and Tutorials walk users through all the steps and options. The sample project gallery within the software offers prepared workbooks in a number of styles and formats, which users can replicate or swap data into to create their own graphs (see Figure 2).
Additionally, there is a Graph Gallery on OriginLab.com with industry-specific examples and case studies that are updated regularly to provide the most up-to-date samples.
Once a graph has been developed with exactly the right settings for a particular type of project or dataset, users can either create Graph Templates for the creation of similar graphs, or Graph Themes to update the style and format of existing graphs to match a consistent look. Both tools help produce professional-grade reports and publications.
While OriginPro 8.5 was targeted and labeled a major release from OriginLab, OriginPro 8.5.1 contains enough new functionality to be considered a major release unto itself.
New Gadgets
Gadgets in OriginPro are tools that perform quick analyses on Regions of Interest (ROI) within a graph, shown by the yellow rectangle in Figure 3. Gadgets, introduced in OriginPro 8.5, are transient selections, using a rectangle, circle or ellipse on an existing graph, that report back information. The results calculated within a Gadget are updated dynamically as the ROI is dragged within a graph. Version 8.5.1 added four additional Gadgets:
- The Quick Peaks Gadget can identify both positive and negative peaks within a given plot. Quantities such as a Peak Area, Peak Height, Peak Center and full width at half maximum (FWHM) are reported. Peaks can be tagged and multiple peaks can be fitted, while baseline data can be identified and subtracted.
- The Cluster Manipulation Gadget performs basic statistical calculations on a cluster of data or on the points outside the selected ROI. Data points can be edited, deleted or temporarily masked. Data includes number of points, sum, mean, median, standard deviation and min/max.
- The Statistics Gadget provides an added level of statistical output on the selected ROI.
- The Digitize Image Gadget allows users to import scanned graphs from books, journals or faxes and convert them into digitized tabular and graphical output. The process has an intuitive, but manual graphical user interface (GUI) for axis definition and point selection. However, with the graphical feedback and subsequent data analysis, the value of this work is readily apparent. The images in Figure 4 show the key elements of this process. A faxed stress-strain curve was photographed with a cell phone camera and digitized. OriginPro 8.5.1 allowed the image to be rotated with reasonable precision and the axes were defined. In this step, the strain axis was automatically converted from “percent strain” to actual strain, so that slope calculations would have the proper units.
Users can zoom in on the image while selecting points to improve precision. The overlay plot is visible upon point selection, which can help users can determine whether more points are required to capture curvature. OriginPro orders points as selected, so if a user backtracks to add points, he or she must simply re-sort the data based on x-value. The plot updates automatically.
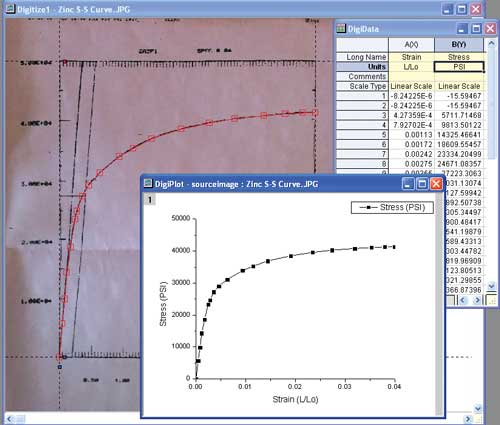
Figure 4: The Faxed Stress-Strain curve is digitized.
Multiple traces can be added to a single graph with corresponding, independent columns. Once complete, the tabular data can be exported to a text file or Microsoft Excel for use in other calculations, such as finite element analysis (FEA) material definition.
Additional New Features
OriginPro’s non-linear curve fitter has been updated in version 8.5.1 to fit multiple 3D peaks in a dataset. Surface fitting techniques are used in many scientific fields, such as spectroscopy, mathematics, electrical engineering and earth sciences. Nineteen different surface fitting models are available, including Gauss2D, DoseReponse2D, Exponential2D and Polynomial2D. These calculations can be automatically updated if the underlying data changes, or the settings can be saved as an Analysis Theme to use later with similar data.
One differentiator of OriginPro is the complete control a user has over the format of data for publication. Most researchers and engineers understand that while presentation can’t replace compelling data, it can open up opportunities for more widespread and detailed review, with a favorable attitude toward conclusions.

Figure 5: Standard color palettes in OriginPro 8.5.1.
To that end, OriginPro provides access to the seemingly small details that can really make a difference. In OriginPro 8.5.1, a number of enhancements have been made, including improvements to the plot color palette.
OriginPro has many built-in coordinated color palettes that can be added to, modified and saved. Figure 5 shows some of the color palettes that can be applied to different types of graphs.
The vast majority of improvements to OriginPro are driven by customer input collected by the manufacturer’s technical support team, according to the company. Users receive 90 days’ free support with each purchase and ongoing maintenance plans are available. Current maintenance customers also receive upgrades during their maintenance period.
Vince Adams, currently an account manager for LMS, is a longtime simulation educator, consultant and speaker. He has authored three books on finite element analysis and numerous magazine articles. Contact him via [email protected].
For more information:
Subscribe to our FREE magazine, FREE email newsletters or both!
About the Author
DE’s editors contribute news and new product announcements to Digital Engineering.
Press releases may be sent to them via [email protected].


