NXP’s new software helps engineers with sensor fusion applications. Image courtesy of Sensor Fusion.

Latest News
October 3, 2016
 NXP’s new software helps engineers with sensor fusion applications. Image courtesy of Sensor Fusion.
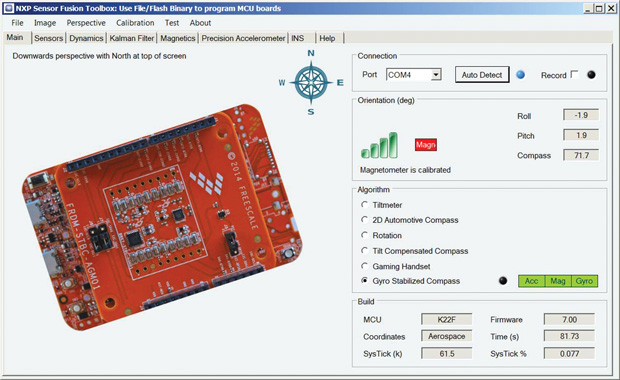
Mike Stanley, a systems engineer at NXP, constructed a miniature water delivery system that included a pump and an accelerometer mounted on one of the pipes. That was the centerpiece of his presentation at this year’s Sensor Expo and Conference (San Jose, CA, June 22-23).
“There’s often information in sensor signals you may not have anticipated,” Stanley explains.
The purpose of the accelerometer was to measure the vibrations transmitted from the pump into the pipe. Vibration signatures accumulated over time reflected the health of Stanley’s improvised system. By simulating blockages and recording the vibration signatures corresponding to those periods, Stanley learned to read signs of pending problems. That, he pointed out, was one way to “determine the health of a system from vibrations.”
To be precise, Stanley didn’t learn to read the vibrations. Distinguishing signs of anomalies from normalcy was an algorithm-driven process completed in software. It’s machine learning, an artificial intelligence (AI) application that many see as a remedy to sensor data headaches.
AI Training
Employed by a well-known semiconductor maker, Stanley has a variety of sensors and PCB boards at his disposal for the experiment. He used an NXP RD-KL25-AGMP01 board as a data logger, with the sole purpose of sending the vibration data from the accelerometer to his workstation via a wired connection.
“The data analysis was done in MathWorks’ MATLAB,” says Stanley. “I ran machine learning algorithms on the sensor readings from different runs. MATLAB has a pretty good collection of machine learning routines and they’re fairly easy to use.”
Machine learning usually involves a computation-intensive training phase, where the software uses a large data set—in this case, sensor readings representing periods of water flow and pump closure—to understand and differentiate signs of normal operation and signs of trouble or failure.
“The techniques I used are no different from the machine learning techniques now used by Google or Amazon in some projects,” says Stanley. At a larger scale, the same process can be used to train autonomous vehicles and self-navigating drones to recognize police cars, ambulances, road signs, power lines, trees and obstacles from camera-captured imagery.
Based on the amount of data involved and the computing capacity delegated, the training could take days, weeks or months. The more powerful the computing system, the faster the training. This is the reason rival processor makers like NVIDIA and Intel regard machine learning as an area of opportunity.
“The Statistics and Machine Learning Toolbox built on top of MATLAB has interactive apps that guide you through the workflow for statistical analysis and machine learning,” says Paul Pilotte, technical marketing manager at MathWorks. “MATLAB and other toolboxes also make it easy to perform sensor analytics with image processing, signal processing, and more. Some image processing and image classification tasks are very compute-intensive. Deep learning is becoming a popular technique for automatic image classification. You can get results if you have a large corpus of images to train a model. For these challenging tasks, we offer a Neural Network toolbox, with a popular deep learning algorithm (CNN) that can be used with NVIDIA GPUs to speed up model training.”
With sufficient training completed, the insights gained can be distilled into a much smaller program. Such a program or applet can run locally on a low-powered device (like a smartphone or a drone) as the decision-making mechanism in self-guided operations. In Stanley’s case, it can be used to issue alerts when it detects water flow disruptions. In autonomous cars and drones, it could form the basis for unsupervised navigation.
“Once the training is done, I then generated the C-code that runs on my other board, which performs system status validation in real time,” Stanley says.
In the MathWorks white paper titled “Machine Learning Challenges: Choosing the Best Model and Avoiding Overfitting,” the authors pointed out: “Machine learning proficiency requires a combination of diverse skills, but the apps, functions and training examples found in MATLAB can make mastering this technique an achievable goal.”
Unlikely Insights from Sensors
Some of the inferences you can draw from sensor data might surprise you. Shyamal Patel, senior technical product manager from MathWorks, recounted a project where MATLAB was used to determine a person’s heart rate in real-time using the luminance data from video footage of the fingertip captured by a smartphone camera—a process many health apps on the market now employ.
“You can take a video of your fingertip with your smartphone,” explains Patel. “From the video frames, we can extract luminance information, which changes as blood flows in and out of your fingertip with each heartbeat. If we analyze the luminance changes in the video frames over a period of time, we can estimate the periodicity and ultimately deduce the heart rate.”
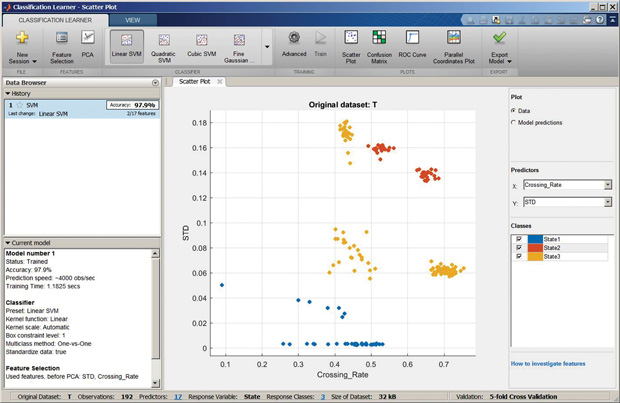 The Statistics and Machine Learning Toolbox built on top of MATLAB has interactive apps that guide you through the workflow for statistical analysis and machine learning. Image courtesy of MathWorks.
However, Patel cautioned, drawing inferences about someone’s health using a single type of sensor data is a challenge due to individual differences. The process should be augmented by other data sources, such as an individual’s activity level and text inputs about his or her own emotional state.
A Window into Time
The key to Stanley’s experiment was time-stamped data. “If you’re looking for anomalies in a large data set, you actually need the ability to tag the events with time codes,” he says. “I have sensor data, but I also have additional data that identifies that specific data lines correspond to specific events [such as the pump’s close and open states].”
Reflecting on his water pump demonstration, Stanley says: “What I did was hardware-in-the-loop simulation. In my setup, I could control the events, so it worked as a simulator.” Conducting simulation with large-scale physical systems, however, would prove far more challenging. For instance, experiments possible with water flow in a citywide water delivery system would be severely limited due to its effects on the residents who rely on it for daily water use.
Many IoT (Internet of Things) applications involve more than one type of sensor. Often, system designers have to combine data from a variety of sources to draw inferences, in a process known as sensor fusion. (For more read “Harnessing the Power of Sensor Fusion”).
The Right Frequency
Because sensors are now becoming much more affordable, engineers might be tempted to deploy them wherever possible to collect data. However, Pilotte cautions that there are significant costs associated with uploading or sending the data over a network around the clock, so a good practice is to consider the entire system.
“The wireless uplink can be very expensive depending on the location and amount of data uploaded,” he advises. “So, in some cases, you’re better off embedding some of the processing or machine learning algorithms with the sensor, and just sending data about the anomalies. Some signals may need to be uploaded in real-time to identify pending warnings or catastrophic failures; other signals that help you identify trends, root causes, or help you with design changes could be bulk-uploaded during weekly maintenance visits. You want to consider the overall sensor analytics design to optimize where to place the analytics”
Recently, the drive to build and maintain digital twins—digital models that mimic their real-world counterparts based on real-time sensor data—has begun to pick up momentum, driven in part by the demonstrations of some major design software vendors. (For more, read “Driving Toward Digital Twins”).
“If you want to do that, the latency could be a problem [the delay in receiving the sensor data from the field]. But in many systems, you’re not interested in second-to-second updates. You might only be interested in updating your digital model at longer intervals. There’s no reason you can’t model that,” Stanley points out.
More Info
Subscribe to our FREE magazine, FREE email newsletters or both!
Latest News
About the Author
Kenneth Wong is Digital Engineering’s resident blogger and senior editor. Email him at [email protected] or share your thoughts on this article at digitaleng.news/facebook.
Follow DE

