Analytical Visualization Uncovers More Detail, 1 in a Series
In this second installment in DE's deeper exploration into visualization, we take a look at the integration of analysis.


Latest News
February 3, 2009
By Mark Clarkson
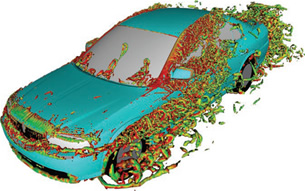 This PowerFLOW aeroacoustic simulation visualized in Exa PowerVIZ identifies noise sources around an automobile via vortex cores. Simulations such as these help vehicle manufacturers isolate noise sources early in the design cycle. |
We looked at the field of analyticalvisualization and found that more people are doing more iterations of moresimulations using more nodes and more types of physics. Plus, it is all beingaccomplished with more processor cores on more computers.
BetterGraphics
You might have noticed that high-end visualization is getting betterlooking. You’ll see translucency, transparency — even texture mapping — to placean image of the actual design (e.g., a circuit board) onto the simulationmodel.
“If I’m visualizing the airflow inside a computer chassis,” saysDerrek Cooper of Blue Ridge Numerics, “I want you to show me the computerchassis as well. We can leverage the graphics and lighting and textures neverconsidered before in the simulation world. You’ll see a lot more ofthat.”
But what’s the point? Why bother with the pretty pictures andanimations?
Consider a computational fluid dynamics (CFD) solver. Its outputis numbers. Lots of numbers. How can the engineer make sense of all of thisdata? By visualizing it.
“Visualization,” says Mike Peery of Tecplot, “isabout identifying the virtual tiger in the data jungle. We know something’sgoing on in there, but how do we identify where it is? How do we communicateit?”
With pictures, clearly. And, niceties like texture mappingnotwithstanding, all the visualization standards — contours, vectors,isosurfaces, streamlines — remain basically the same.
Scale &Multiple Physics
What has also changed is the sheer scale of the data intoday’s simulations, which regularly comprise millions — or tens of millions —of nodes or elements. “Most people size their problem to run overnight,” saysTecplot’s Scott Imlay. “The more powerful computers get, the bigger the problemsget.
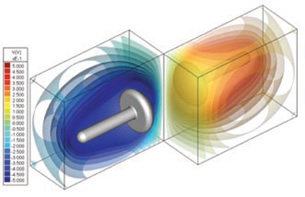 An example of voltage isosurfaces in Integrated Software’s COULOMB, which is a 3D electric field solver. |
“Our customers are looking at more cases. It’s not just that each caseis larger — it is — but there are a lot more cases. They used to look at one ortwo overnight; now they’re looking at a hundred.”
Simulation across time isbecoming more common as well. “The reality,” says Ric Leeds of Exa Corporation,“is that everything moves. Everything’s in time. To get accurate analysis youhave to make design changes in the context of that changing, unsteadyflow.”
And engineers are demanding simulations that run, not just acrosstime, but across different domains of physics.
“At the dawn of computersimulation,” says David Kan of COMSOL, “there was a need to divide up differenttasks into their different physics — fluid dynamics, structural mechanics,magnetic waves. That totally made sense. You couldn’t compute everything on onecomputer.
“But in real life, everything is multiphysics.”
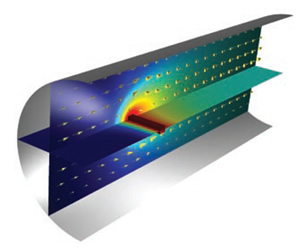 A fluid carrying several chemical components flows through past a wire that is heated through Joule heating in order to detect changes in density through its subsequent cooling through convection. However, the wire’s temperature ignites exothermic chemical reactions, which increases the temperature even more. This COMSOL image shows the temperature distribution in the detector compartment while the arrow plot indicates the flow. |
Consider acircuit breaker: voltage causes heat, heat causes displacement, displacementtrips the breaker. One simple device, three kinds of physics. “As the industrygets into more and more realistic simulation,” says Kan, “it has to includemultiphysics.”
Visualizations must keep up. If I’m simulating surfacetemperature and airflow, I want to see both of them, animated over time.
Howare developers accommodating ever-increasing numbers of ever-larger simulations?With some help from the underlying hardware.
Hardware Help
Oneexample is the migration of developers and customers to 64-bit architectures,enabling access to much more RAM. “You now routinely get 32GB of RAM,” saysBruce Klimpke of Integrated Engineering Software. “That really has opened thedoor to simulations that were in the workstation world before.”
Historically,we could also rely on ever-faster processors to help us out, but CPU clockspeeds haven’t increased lately. Instead, we’ve seen the proliferation ofmultiple cores. Even mild-mannered desktop PCs regularly possess two processorcores. Four and eight cores are common.
“This has also increased the size ofproblem we can handle,” says Klimpke. “A 2D problem that requires 100 differentiterations to come to the optimal value may have taken an hour on a single-coreCPU. If you tried to do that in 3D, you’d be talking days or months. So theability to even do these problems in 3D is a big change.”
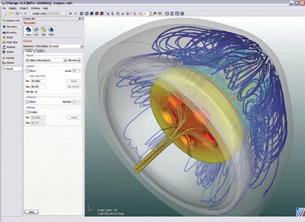 Simulation results from the Quick Natural Convection functionality in CFdesign V10 is of great benefit to design engineers wishing to integrate LED lighting into their product. |
While fasterprocessors automatically mean faster applications, multiple processors don’t,says Klimpke. “You can’t take your old serial code and put it on amulti-processor machine and expect it to go faster. You have to scrap your oldways of developing software. It’s not an evolution, it’s a revolution.”
Arevolution that developers have no choice but to join, says NVIDIA’s SumitGupta: “There is no choice for scientific computation and high-performancecomputing. They have to start programming in parallel. They have to modify theirapplication, take their key computational kernel, and look for the parallelismin it.”
NVIDIA and Gumpta know about parallelism. While CPUs have gonemulticore, the GPUs (graphics processing units) found on video cards have gonemassively multicore.
To leverage this potential number-crunching power,NVIDIA developed the Tesla. The Tesla uses GPUs — 240 of them, in fact — but ithas no graphics output. It’s purely a number crunching engine, with featureslike shared memory and double-precision floating-point math that aren’t usefulfor graphics, but are essential for scientific computing.
Tesla shows thepotential for engineering workstations with hundreds or thousands of cores. Anysimulation and visualization product worth its salt will take advantage of everycore available.
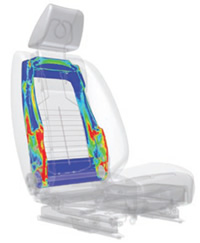 In this particular example, the non-analyzed parts are shown using transparency — providing a good view of the analysis results while also providing a very clear understanding of the relationship between what was analyzed and the product as a whole. |
Distributed Computing
Once the code is parallelizedand scalable, there’s no reason to limit it to running on a singlecomputer.
“Many customers,” says Bob Williams of ALGOR, “are using a Windowsdesktop computer to do the things a human needs to do, like defining thegeometry and looking at visualizations. But for the behind-the-scenes numbercrunching, you want to leverage as much computing power as possible. We allowyou to submit the actual analysis to a bank of computers in the corner. You canspend all of your time being productive.”
SIMULIA calls its similar featureremote visualization. “You can look at the results while the analysis isrunning,” says SIMULIA’s Asif Khan. “You don’t have to wait for it to completeto make sure the model is correct, see the deformation or movement, plot thestresses, and so on.
“You have full access, but you only stream the datathat’s needed. Only the display, rendering, and manipulation is done on thelocal computer.”
There are plenty of tasks that can leverage this type ofcluster-based computing. ALGOR recently added support for meshing on distributedhardware. Visualization is another obvious candidate.
Make itEasier
Getting and using good visualizations can be … challenging. Theworst-case scenario goes something like this: you create a model in CAD, thenexport it to a preprocessing application that creates a mesh appropriate foryour simulation. Next, you load the mesh into a solver, which solves themillions of differential equations and spits out gigabytes of data. Then bringthose results into a postprocessor that allows you to slice, dice, plot, print,and animate. Take the knowledge gained back into your CAD application, redesign,and start over. Lather, rinse, repeat.
If you’re doing multiphysics, it getseven worse, as you may have to iterate between two or more solvers, severaltimes. And there are as many different types of analysis as there areengineering disciplines – structural, electromechanical, chemical, fluid,temperature.
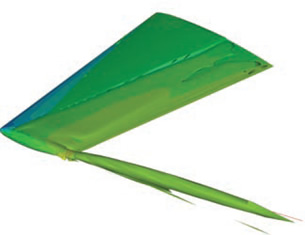 The ability to visually zero-in on critical data features buried in increasingly massive sets is crucial to effective visualization analysis. The ë2 isosurface shown in this Tecplot image is an example of how data can be isolated. Notice how the wing tip vortex is clearly represented as a tube extending downstream from the wing tip, which allows engineers to better determine performance and behavior. |
It’s a Byzantine labyrinth you’d probably rather not even enter.That’s why ease of use and increasing automation are key.
“There’s a hugepool of engineers that we’re trying to help out,” says Blue Ridge’s Cooper. “Inthat respect, we can’t give them too many options. They want to push a fewbuttons and get results.
“That’s a trend we’re seeing. People don’t want tothink of things from a preprocessor and a solver and a postprocessorperspective. Most of our customers want that interaction streamlined as much aspossible. They say, ‘Of course you should do all this stuff automatically,because I don’t want to.’”
The Holy Grail
“Ultimately,” says ALGOR’sWilliams, “you shouldn’t have to worry about — or even know – which individualanalyses are running behind the scenes. You’re designing a product. You know theenvironment in which it’s going to operate. You ought to be able to take thisdigital prototype of your design and define the environment it’s in. Thesoftware should be smart enough to perform the correct simulations based on theenvironment the product’s in. You just watch a movie.”
Eventually it’s allheading toward that goal: being able to do a true representation of a product,in real time, sitting in a realistic environment.
Maybe next year.
A list of visualization resources is provided at the end of part 1 in thisseries.
Contributing Editor Mark Clarkson, a.k.a. “the Wichita By-Lineman,” hasbeen writing about all manner of computer stuff for years. An expert in computeranimation and graphics, his newest book is “Photoshop Elements by Example.“Visit him on the web at markclarkson.com or send e-mail about thisarticle c/o [email protected].
Subscribe to our FREE magazine, FREE email newsletters or both!
Latest News
About the Author
Mark ClarksonContributing Editor Mark Clarkson is Digital Engineering’s expert in visualization, computer animation, and graphics. His newest book is Photoshop Elements by Example. Visit him on the web at MarkClarkson.com or send e-mail about this article to [email protected].
Follow DE

