Analytical Visualization Uncovers More Detail, 2 in a Series
In this second installment in DE's deeper exploration into visualization, we take a look at its integration with analysis.


March 2, 2009
By Mark Clarkson
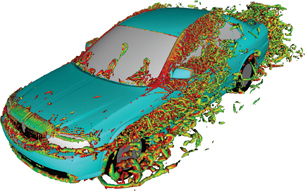 This PowerFLOW aeroacoustic simulation visualized in Exa PowerVIZ identifies noise sources around an automobile via vortex cores. Simulations such as these help vehicle manufacturers isolate noise sources early in the design cycle. Image courtesy Exa Corporation This PowerFLOW aeroacoustic simulation visualized in Exa PowerVIZ identifies noise sources around an automobile via vortex cores. Simulations such as these help vehicle manufacturers isolate noise sources early in the design cycle. Image courtesy Exa Corporation |
In part 1, we looked at the field of analytical visualization and found that more people are doing more iterations of more simulations using more nodes and more types of physics than ever before. Plus, it is all being accomplished with more processor cores on more computers.
Better Graphics
You might have noticed that high-end visualization is getting better looking. You’ll see translucency, transparency—even texture mapping—to place an image of the actual design (e.g., a circuit board) onto the simulation model.
“If I’m visualizing the airflow inside a computer chassis,” says Derrek Cooper of Blue Ridge Numerics, “I want you to show me the computer chassis as well. We can leverage the graphics and lighting and textures never considered before in the simulation world. You’ll see a lot more of that.”
But what’s the point? Why bother with the pretty pictures and animations?
Consider a computational fluid dynamics (CFD) solver. Its output is numbers. Lots of numbers. How can the engineer make sense of all of this data? By visualizing it.
“Visualization,” says Mike Peery of Tecplot, “is about identifying the virtual tiger in the data jungle. We know something’s going on in there, but how do we identify where it is? How do we communicate it?”
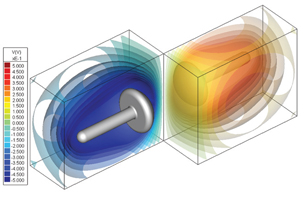 An example of voltage isosurfaces in Integrated Software’s COULOMB, which is a 3D electric field solver. Image courtesy Integrated Software |
With pictures, clearly. And, niceties like texture mapping notwithstanding, all the visualization standards—contours, vectors, iso surfaces, streamlines—remain basically the same.
Scale & Multiple Physics
What has also changed is the sheer scale of the data in today’s simulations, which regularly comprise millions—or tens of millions—of nodes or elements. “Most people size their problem to run overnight,” says Tecplot’s Scott Imlay. “The more powerful computers get, the bigger the problems get.
“Our customers are looking at more cases. It’s not just that each case is larger—it is—but there are a lot more cases. They used to look at one or two overnight; now they’re looking at a hundred.”
Simulation across time is becoming more common as well. “The reality,” says Ric Leeds of Exa Corporation, “is that everything moves. Everything’s in time. To get accurate analysis you have to make design changes in the context of that changing, unsteady flow.”
And engineers are demanding simulations that run, not just across time, but across different domains of physics.
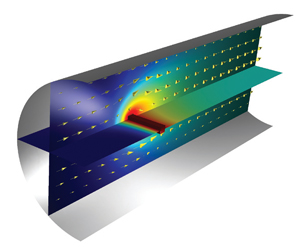 A fluid carrying several chemical components flows past a wire that is heated through Joule heating in order to detect changes in density through its subsequent cooling through convection. However, the wire’s temperature ignites exothermic chemical reactions, which increases the temperature even more. This COMSOL image shows the temperature distribution in the detector compartment while the arrow plot indicates the flow. Image courtesy COMSOL A fluid carrying several chemical components flows past a wire that is heated through Joule heating in order to detect changes in density through its subsequent cooling through convection. However, the wire’s temperature ignites exothermic chemical reactions, which increases the temperature even more. This COMSOL image shows the temperature distribution in the detector compartment while the arrow plot indicates the flow. Image courtesy COMSOL |
“At the dawn of computer simulation,” says David Kan of COMSOL, “there was a need to divide up different tasks into their different physics—fluid dynamics, structural mechanics, magnetic waves. That totally made sense. You couldn’t compute everything on one computer.
“But in real life, everything is multiphysics.”
Consider a circuit breaker: voltage causes heat, heat causes displacement, displacement trips the breaker. One simple device, three kinds of physics. “As the industry gets into more and more realistic simulation,” says Kan, “it has to include multiphysics.”
Visualizations must keep up. If I’m simulating surface temperature and airflow, I want to see both of them, animated over time.
How are developers accommodating ever-increasing numbers of ever-larger simulations? With some help from the underlying hardware.
Help from Hardware
One example is the migration of developers and customers to 64-bit architectures, enabling access to much more RAM. “You now routinely get 32GB of RAM,” says Bruce Klimpke of Integrated Engineering Software. “That really has opened the door to simulations that were in the workstation world before.”
Historically, we could also rely on ever faster processors to help us out, but CPU clock speeds haven’t increased lately. Instead, we’ve seen the proliferation of multiple cores. Even mild-mannered desktop PCs regularly possess two processor cores. Four and eight cores are common.
“This has also increased the size of problem we can handle,” says Klimpke. “A 2D problem that requires 100 different iterations to come to the optimal value may have taken an hour on a single-core CPU. If you tried to do that in 3D, you’d be talking days or months. So the ability to even do these problems in 3D is a big change.“
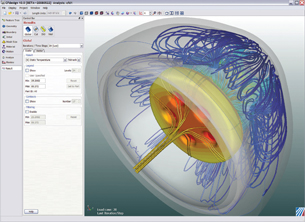 Simulation results from the Quick Natural Convection functionality in CFdesign V10 is of great benefit to design engineers wishing to integrate LED lighting into their product. Image courtesy Blue Ridge Numerics Simulation results from the Quick Natural Convection functionality in CFdesign V10 is of great benefit to design engineers wishing to integrate LED lighting into their product. Image courtesy Blue Ridge Numerics |
While faster processors automatically mean faster applications, multiple processors don’t, says Klimpke. “You can’t take your old serial code and put it on a multiprocessor machine and expect it to go faster. You have to scrap your old ways of developing software. It’s not an evolution, it’s a revolution.”
A revolution that developers have no choice but to join, says NVIDIA’s Sumit Gupta: “There is no choice for scientific computation and high-performance computing. They have to start programming in parallel. They have to modify their application, take their key computational kernel, and look for the parallelism in it.”
NVIDIA and Gumpta know about parallelism. While CPUs have gone multicore, the GPUs (graphics processing units) found on video cards have gone massively multi core.
To leverage this potential number crunching power, NVIDIA developed the Tesla. The Tesla uses GPUs—240 of them, in fact—but it has no graphics output. It’s purely a number crunching engine, with features like shared memory and double precision floating-point math that aren’t useful for graphics, but are essential for scientific computing.
Tesla shows the potential for engineering workstations with hundreds or thousands of cores. Any simulation and visualization product worth its salt will take advantage of every core available.
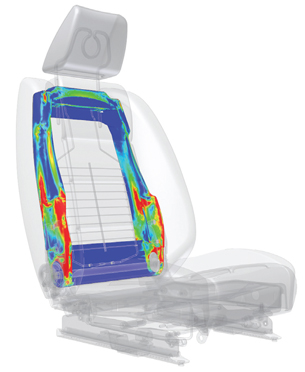 This image of an analysis of a car seat’s steel frame modeled in Inventor shows its relationship with the entire seat assembly under normal operating conditions. The use of transparency provides a clear understanding of the relationship—one of the benefits of a digital prototype. Image courtesy Autodesk |
Distributed Computing
Once the code is parallelized and scalable, there’s no reason to limit it to running on a single computer.
“Many customers,” says Bob Williams of ALGOR, “are using a Windows desktop computer to do the things a human needs to do, like defining the geometry and looking at visualizations. But for the behind the- scenes number crunching, you want to leverage as much computing power as possible. We allow you to submit the actual analysis to a bank of computers in the corner. You can spend all of your time being productive.”
SIMULIA calls its similar feature remote visualization. “You can look at the results while the analysis is running,” says SIMULIA’s Asif Khan. “You don’t have to wait for it to complete to make sure the model is correct, see the deformation or movement, plot the stresses, and so on.
“You have full access, but you only stream the data that’s needed. Only the display, rendering, and manipulation is done on the local computer.”
There are plenty of tasks that can leverage this type of cluster-based computing. ALGOR recently added support for meshing on distributed hardware. Visualization is another obvious candidate.
Make It Easier
Getting and using good visualizations can be … challenging. The worst-case scenario goes something like this: You create a model in CAD, then export it to a preprocessing application that creates a mesh appropriate for your simulation. Next, you load the mesh into a solver, which solves the millions of differential equations and spits out gigabytes of data. Then bring those results into a postprocessor that allows you to slice, dice, plot, print, and animate. Take the knowledge gained back into your CAD application, redesign, and start over. Lather, rinse, repeat.
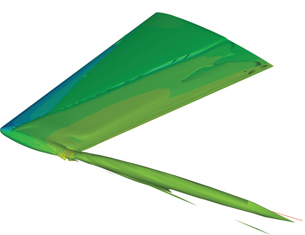 The ability to visually zero-in on critical data features buried in increasingly massive sets is crucial to effective visualization analysis. The ë2 isosurface shown in this Tecplot image is an example of how data can be isolated. Notice how the wing tip vortex is clearly represented as a tube extending downstream from the wing tip, which allows engineers to better determine performance and behavior. Image courtesy Tecplot |
If you’re doing multiphysics, it gets even worse, as you may have to iterate between two or more solvers, several times. And there are as many different types of analysis as there are engineering disciplines—structural, electromechanical, chemical, fluid, and temperature.
It’s a Byzantine labyrinth you’d probably rather not even enter. That’s why ease of use and increasing automation are key.
“There’s a huge pool of engineers that we’re trying to help out,” says Blue Ridge’s Cooper. “In that respect, we can’t give them too many options. They want to push a few buttons and get results.
“That’s a trend we’re seeing. People don’t want to think of things from a preprocessor and a solver and a postprocessor perspective. Most of our customers want that interaction streamlined as much as possible. They say, ‘Of course you should do all this stuff automatically, because I don’t want to.’”
The Holy Grail
“Ultimately,” says ALGOR’s Williams,“you shouldn’t have to worry about—or even know—which individual analyses are running behind the scenes. You’re designing a product. You know the environment in which it’s going to operate. You ought to be able to take this digital prototype of your design and define the environment it’s in. The software should be smart enough to perform the correct simulations based on the environment the product’s in. You just watch a movie.”
Eventually it’s all heading toward that goal: Being able to do a true representation of a product, in real time, sitting in a realistic environment.
Maybe next year.
Contributing Editor Mark Clarkson, a.k.a. “the Wichita By-Lineman,” has been writing about all manner of computer stuff for years. An expert in computer animation and graphics, his newest book is“Photoshop Elements by Example.” Visit him on the web at markclarkson.com or send e-mail about this article c/o [email protected].
Subscribe to our FREE magazine, FREE email newsletters or both!
About the Author
Mark ClarksonContributing Editor Mark Clarkson is Digital Engineering’s expert in visualization, computer animation, and graphics. His newest book is Photoshop Elements by Example. Visit him on the web at MarkClarkson.com or send e-mail about this article to [email protected].
Follow DE

