
October 1, 2013
By Erin Hatfield
An estimated 2 million people take to the skies each day, making safety a top priority for aircraft manufacturers. Using both virtual and real-world analysis, companies must rigorously test each plane before it can be put into service. This involves instrumenting thousands of extra points on each test aircraft to gather critical data on the plane’s performance. During real-world flight tests, this instrumentation generates tens of thousands of data points every second—and plotting that data to uncover possible dangers can send flight test engineers into a barrel roll.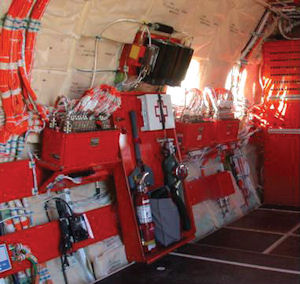 |
Researchers at the Bombardier Flight Test Center (BFTC) have enlisted the help of OriginLab for data analysis and graphing software, to make plotting these points and discovering anomalies a little easier. BFTC uses Origin software to visualize its data and help isolate the cause of warning messages and other anomalies during test flights. Through a custom interface tailored to its workflow, BFTC imports multiple data points and plots them against time variables, while generating diagnostic graphs. Bombardier then makes system design changes as needed to its aircraft, during the development flight test phase.
Thousands of Data Points
Whenever Bombardier manufactures a new type of aircraft, BFTC normally gets the first few planes that come off the assembly line. The researchers perform ground and flight tests on these aircraft, often keeping one plane indefinitely so they can make product improvements, upgrades and other alterations that may commonly occur throughout the lifetime of an airplane. Using this data, BFTC can certify whether the new design is safe to fly, as well as identify any issues with the product.
Bombardier uses systems integration rigs and simulators to assist in the development of its products. This allows systems engineers to inject failures into their systems and safely evaluate each response under each of the failure conditions. The worst-case failures are then demonstrated during the certification testing on the aircraft.
Reliability and maintainability of the aircraft and equipment is an important part of the flight test certification process at Bombardier. On a new type of design program, one flight test vehicle (FTV) is dedicated to function and reliability (F&R) testing—which is simply to operate the aircraft as it would be operated in service, over a specific period of time, to evaluate the ease of use and the robustness of the Bombardier product. Pertinent instrumentation parameters are installed on these FTVs and rigs, to capture the appropriate data and demonstrate compliance with the certification authority regulations. The BFTC engineers specify the different elements for each parameter. These elements define the parameter type, the range, the accuracy and the sample rate, so that even the smallest inconsistency in flight data will be captured and analyzed.
Most production aircraft has standard instrumentation parameters, like those of the flight data recorder monitors and records. The pilot handwheel position is one of those parameters. Some parameters require a higher sample rate to extract minute details to determine acceptable and non-acceptable flight performance. The handwheel data helps engineers determine whether the pilot is correctly flying the aircraft, and this data often becomes an integral part of investigating aircraft incidents and accidents. On each FTV, BFTC also installs an instrumentation package, adding thousands of calibrated parameters to ensure that crucial data is collected.
“When certifying an aircraft system, every component of that system is instrumented to capture data for the purpose of demonstrating compliance, or for troubleshooting that system if it malfunctions in flight,” notes Michael Konicki, section chief with BFTC. “For example, with the spoilers, we’re concerned with the spoiler control lever, handwheel and the surface positions—in addition to all of the inputs and outputs to the electronic control unit that controls the spoiler surface positions. When analyzing flight controls, we produce cross-plots of the pilot’s control angular position to the surface angular position. These plots produce a hysteresis curve, which provides the engineer with vital information, often identifying a system deadband.”
Analysis and Customization
The instrumentation package on the flight test aircraft generates tens of thousands of data points a second. Each parameter can be programmed to record data at a rate ranging from a sample every second to 1,024 samples every second. For BFTC to observe, analyze and make sense of all this information, however, is a substantial undertaking. The department required a graphing and data analysis tool that could manage the large volumes of data generated by each instrument, while being flexible enough to facilitate importing different file formats.
 |
About 10 years ago, BFTC began using Origin to graph and analyze its test flight data. Designed for ease-of-use for customers at varying technical levels, Origin’s solution provided the flexibility and functionality to manage BFTC’s complex data analysis and graphing.
With Origin, BFTC continues to be able to quickly and easily analyze its flight test data, and export it for reports and regulatory compliance. The team’s flight test engineers highly value Origin’s ability to handle large datasets in virtually any format.
“We had instances where we’ve collected 2 kHz of data, meaning there are 2,000 samples every second,” Konicki reports. “The high volume of data required us to use Origin, because Excel wasn’t an option due to row limits in earlier versions of the software. Origin doesn’t have that limit, and we’ve even been able to process a dataset with more than 1.5 million rows.”
Origin also contains a built-in dialog builder, which the flight test team uses to create and fine-tune a custom interface. By customizing the interface, BFTC is able to handle a collection of data from various formats, including the team’s proprietary in-house file format.
“The custom Origin interface enables us to prebuild our datasets, move the data to and from specific locations, and call it up automatically,” says Konicki. “We can import data using the tool, modify the plots, apply templates, and then export them to PDFs, which we use in our reports—all in a single solution. Any type of data that we need to report, we can adapt the custom interface to process that data, a practice that is much more complex in Excel and other software. The ease of plotting and integration into our data system are key components of the Origin system.”
Over the years, BFTC has continued to work closely with the OriginLab team to ensure that this interface optimizes Origin’s latest features and capabilities.
Troubleshooting Flight Errors
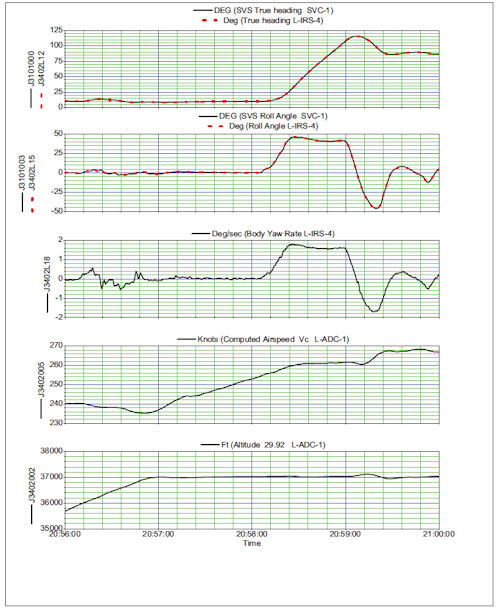
Using the custom Origin interface, BFTC creates graphs of the data gathered from each instrument on the test flight. Most often, the team plots the data against time, a practice that enables them to quickly and easily identify data outliers and pinpoint the timeframe when any instances occur.
When needed, Origin’s robust functionality allows the flight test engineers to plot two positions on the same plot and see how they line up. The solution also enables BFTC to create cross-plots with completely different variables, or derive a third parameter from two measured parameters. Konicki says the team can manipulate how data is displayed to ensure it is in the most advantageous format.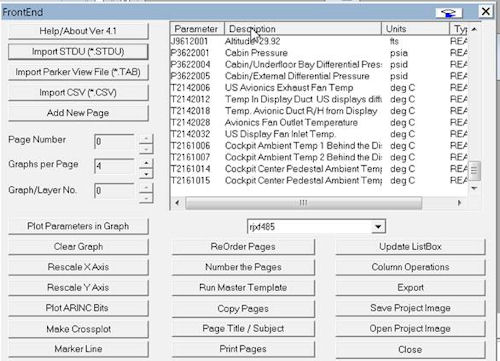
But where Origin really excels, says Konicki, is troubleshooting any test flight errors. On occasion, flight test engineers might receive a warning message that posts and blinks for a few seconds, then goes away. This raises a red flag for the crew, who then works to narrow down the problem and identify the error. Using the data collected from the instrumentation after it’s graphed in Origin, however, BFTC can pinpoint the error, which can range from a loose wire connection to the pilot overcorrecting the controls.
“Without the ease of plotting the data in Origin, it would take our team a lot more time and effort to troubleshoot the issues that arise during a test flight,” adds Konicki. “Even though we’re tracking multiple variables, we know what time an error occurred and can go back to that time to see what happened. Having data to review saves us from taking a shotgun approach to troubleshooting, such as unnecessarily replacing line-replaceable units (LRUs), to try to solve the problem.”
Erin Hatfield is a freelance writer specializing in software and technology topics. She wrote this article on behalf of OriginLab.
More Info
Subscribe to our FREE magazine, FREE email newsletters or both!
About the Author
DE’s editors contribute news and new product announcements to Digital Engineering.
Press releases may be sent to them via [email protected].


