

Latest News
May 1, 2008
By George Laird
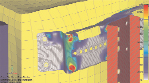
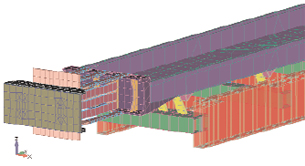 The motor mount for this vibrating conveyor is the mass of flexible metal plates hanging off the endof the conveyor. Yellow elements are fiberglass laminate springs; the motor is not shown. |
In part I of this series (see DE April 2008), we explained the concept that every structure has natural frequencies of vibration (eigenvalues) and that these natural frequencies have specific deformation shapes (eigenmodes or normal modes). We also took a swipe at how one would use this information in the structural design world by noting that excitation frequencies outside of a structure’s first couple of eigenvalues means it will behave statically stable. We now want to expand upon this theme and demonstrate how this simple form of analysis can be leveraged to uncover how your structure might behave under dynamic loading.
The Dominators: Modes with Mass
An interesting fact about normal modes analysis is that we can associate a percentage of the structure’s mass to each mode. With enough modes, you get 100 percent of the mass of the structure, though for complex structures this can mean hundreds of modes. The common thought is that if you capture 90 percent of the mass of the structure that will be good enough. For now, we’ll start classically and then show what this concept means in a real-world engineering situation.
We use the supported beam because it is simple to visualize, simple to formulate, and best of all, simple to draw on a white board. In Figure 1, we show a quick example of the first three modes of a simple supported beam along with the percentage of mass associated with the mode. The first mode dominates with 82 percent of the mass of the beam swinging up and down. The second and third modes contribute a little bit of mass but nothing like what we saw in the first mode.
All of these modes operate in one direction. In the real world, the mass fraction is associated with all six degrees of freedom within a particular natural frequency. What this means is that if we excite this first mode in the vertical direction (the direction of the mass fraction), then the structure will move with 82 percent of its mass behind this mode. If we think like Newton and realize that F=m*a, then we can visualize the dominance of this mode and the huge forces that can be generated at resonance.
Pea Pod Transport
Let’s leverage this information in a couple of typical engineering problems. Manufacturers use vibrating conveyors to move materials ranging from pea pods to lumps of coal. One such vibrating conveyor is shown above. It moves pea pods within a food-processing plant using a vibratory motor that creates a sinusoidally varying force that is aligned down the axis of the conveyor (y-axis). This force causes the conveyor to swing forward and up on its fiberglass laminate springs.
When operating at its resonant frequency, the conveyor tosses the pea pods forward and upward in a gentle swinging fashion. The material transport rate is determined by its operating frequency and the length and angle of the fiberglass spring laths.
A fundamental problem with this type of conveyor is that during startup as the vibratory motors spin up to speed, nonoperating modes get excited, often causing the conveyor to tear itself apart before it reaches the target operating frequency. Our eigen analysis of the conveyor shows that it has to pass through three modes before reaching its operating frequency at 18Hz. Table 1 shows a brief summary of the data harvested from this analysis.
| |||
| Figure 1: This illustrates a vibration analysis of a simply supported beam. From left, the normal mode shows a specific deformation shape where 82 percent of the mass of the beam swings up and down; the second and third modes of the beam only occur at much higher frequencies. In the second,only 10 percent of the mass deforms this way, and in the third, only 3 percent. These modes have very little effect on the overall behavior. |
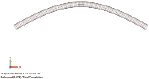
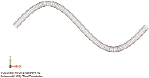
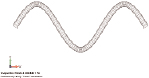
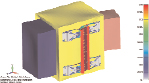
Along with this hard data we have the shapes of these four modes shown in Figure 2. We now have a complete picture of the dynamic mechanical behavior of the conveyor system.
Although the vibratory motor has to drive through three modes to reach the target frequency of 18Hz, it has three things in its favor: the applied force is along the y-axis; the mass fractions of the first three modes are small (less than 6 percent); and the dominant directions of the first three modes are not aligned with the forcing function. Thus, with a basic eigen analysis, one can approve the design of a very complex engineering system.
Making Your Ride as Smooth as Silk
Ever wonder what makes a quiet ride in a motor vehicle? It has to do with avoiding modes that might be driven to resonance; that is to say, keeping the structure dynamically static in its mechanical behavior.
In an analysis of a modern motor home, imagine the FEA model is highly idealized using beam elements for the small structural tubes, plate elements for the main longitudinal beams, and lots of mass elements to represent the engine, air conditioners, water and diesel tanks, and passengers. After a normal modes analysis, we have 45 modes ranging from 2.3Hz to 15Hz.
Trying to figure out which mode will cause trouble is essentially impossible without knowing something about the mass participation within each mode. To help us sort through this mess, we can graphically show the mass participation sums for the x, y, and z directions.
|
Ride smoothness in many cases is just the “hop” in the structure or the bounce in the y-direction. The biggest bounce of interest occurs at mode 21 where the mass participation jumps from around 23 percent to 43 percent (20 percent of the mass is moving upward at mode 21). If we investigate this mode a little deeper, we will find out that the entire coach frame is bucking upward at a frequency of around 10Hz. We now have a pretty good picture of what to avoid — anything around 10Hz.
Luckily, standard road-noise rarely exceeds anything higher than 5Hz. Given our current knowledge of the mode behavior and its mass participation fractions, we are in good shape for a smooth and stable ride.
Designing the Stiffer Structure
One of the realities of a normal modes analysis is that you don’t get any information about the magnitude (deformation or stress) of the actual response. This is due to the fact that you are not applying a load to the structure. While this poses some limitations, we can also use something called the strain energy density to estimate where the structure is the most flexible or the “weakest.”
| ||||
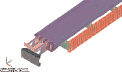
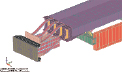
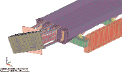
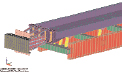
| Figure 2: Four vibrational modes of conveyor belt pictured from the left as it ramps up in frequency to final operating value. Mode 1 shape at 3.5Hz has a mass fraction of 5% along the x axis; Mode 2 shape at 13Hz has a mass fraction of 5.8% along the z axis; Mode 3 shape at 16Hz has a mass fraction of1% in a y axis rotation; and the Mode 4 shape at 18Hz has a mass fraction of 60% along the y axis. |
The mode shape of the structure represents the permissible deformed shape, which directly correlates to the strain energy pattern. Elements with large values of strain are those that most directly affect the natural frequency of that mode. If you can lower the strain energy, you’ll increase that frequency.
Figure 3 shows an electronics enclosure that is attached to a couple of brackets. The strain energy density for the first mode is contoured over the brackets. In this design, the brackets are bolted onto the C-channel used as the attachment point to the building. The design goal is to survive a rather severe earthquake (GR-63-Core Zone 4 specification).
| |||
| Figure 3: (Left) Strain energy density of initial design of electronics housing mounting brackets indicating areas most likely to affect natural frequency of firstmode; (Center) Bracket subjected to simulated earthquake (GR-63-Core Zone 4 spec) showing high strain energy of firstmode at 7Hz at flex pointsof bracket; (Right) Revised bracket design with capped ends displays much lower strain energy and pushes first natural frequency to 10Hz. |

To simulate the earthquake the structure is shaken in all three axes. The first mode at 7Hz has 45 percent of the mass swinging back and forth in the Z-direction as correlated by the high strain energy shown in Figure 3 at the flex points of the bracket. To improve this design, we only need to address the high-strain energy locations. This is done by capping the ends of the bracket. With the bracket reinforced, the strain energy is reduced (as shown in Figure 3) and the frequency jumps to 10Hz.
Advanced Modal Analysis CheckList
Don’t panic when you have eigenvalues right on top of your operating frequencies. Only natural frequencies with significant mass participation factors are important.
Eigenmodes have directions as do their mass participation fractions. Investigate these directions and see if they correspond to your forcing-function direction. If they don’t (let’s say they’re orthogonal), then the structure will remain dynamically stable.
If you need to stiffen up your structure, look at the modes where the mass participation is high and then investigate their strain energy density. Modify your structure to lower the strain energy in high-energy sections and you’ll see a significant increase in your eigenvalues.
Be methodical and look at your structure from all directions. The secret to making a dynamically stable structure is to tie everything together: eigenvalue (the mode frequency); mode direction (i.e., mode shape); mass participation fraction; mass participation direction; and strain energy density. If you remain cognizant of all of these factors, you will have a good degree of success in not being surprised with aberrant or disastrous dynamic behavior in your structure.
George Laird, Ph.D., P.E. is a mechanical engineer with PredictiveEngineering and can be reached at [email protected]. Send comments about this article to [email protected].
Subscribe to our FREE magazine, FREE email newsletters or both!
Latest News
About the Author
DE’s editors contribute news and new product announcements to Digital Engineering.
Press releases may be sent to them via [email protected].


