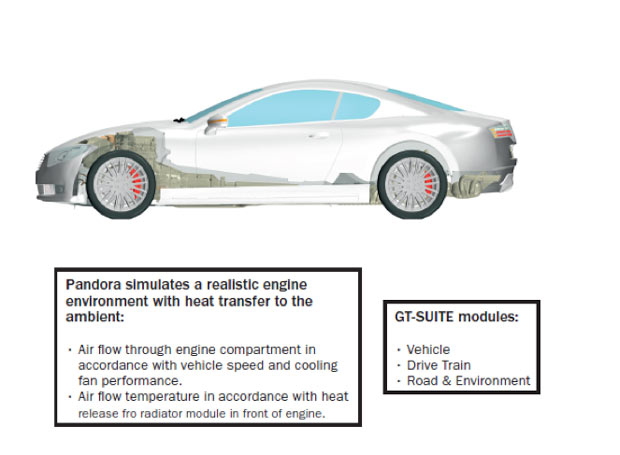
Fig. 4: Pandora is a virtual concept car with underhood and full-vehicle environment modelled with STAR-CCM+ to simulate engine thermal performance with heat transfer to the ambient environment.


Latest News
May 13, 2016
By Gerald Seider, InDesA GmbH
Normally, the data from tests with physical prototypes serves as the foundation for virtual modeling. For example, stresses, torques and pressures captured in a crash test with sensor-equipped manikins provide the inputs necessary to digitally model a car crash. But what if the prototype has limitations that make the output less than ideal? That’s the dilemma engineers face in analyzing the heat rejection.
Combustion engines generate heat by fuel combustion and the friction of moving parts. The current trend is to downsize the engine and increase compression ratios in order to boost power output. But increased power comes at a cost — higher thermal loads. If left unmanaged, the heat can lead to shorter engine lifespan or failure. Therefore, a key component of engine and vehicle development is “heat rejection”— designing a means to manage and dissipate this heat.
Heat rejection needs to be understood early in engine development, but the engine’s combustion and exhaust characteristics from the prototype are often not mature enough for accurate evaluation of heat rejection. So InDesA GmbH developed a new method to predict heat rejection using software-based virtual testing, backed up by data from physical tests.
InDesA is a consulting and engineering services firm specializing in simulation and analysis of complex fluid flow and heat transfer systems based north of Munich, Germany. InDesA’s approach is built around a detailed STAR-CCM+ engine model embedded in a virtual underhood environment. Combustion and exhaust temperatures are derived from 1D engine process simulation using Gamma Technologies’ GT-SUITE software, while friction heat is measured in physical testing.
Supplementing Physical with Virtual Testing
Heat management is essential for peak engine performance at high operating temperatures, and also for optimizing engine behavior during warm-up. Efficiency of combustion engines is significantly lower at cold start than at steady-state temperatures, so it’s important to reduce energy losses. A good strategy is to make sure systems and components reach their intended operating temperature range as rapidly as possible.
Conventionally, predicting heat rejection is done using physical engine prototypes and special-purpose heat rejection test benches. However, once a physical prototype is built, it is expensive to make changes and optimize the engine design. So, issues with heat rejection need to be identified before the first hardware is built.
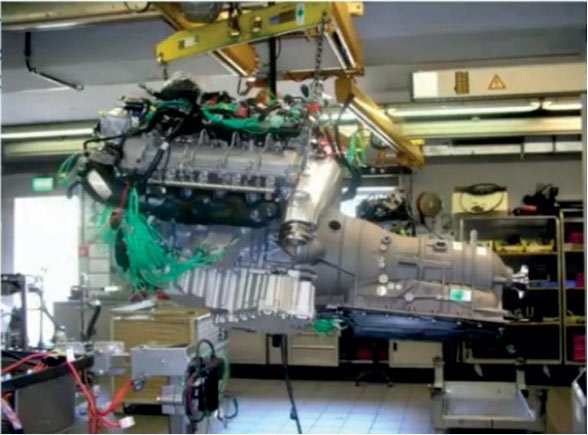 Fig. 1: An early-development-stage physical engine prototype. Image courtesy of BMW.
Early-stage prototype engines, like the one shown in Fig. 1, typically have built-in performance limits to safeguard the engine. These can include restrictions on speed and torque, and an enrichment of combustion mix — all designed to protect the engine by keeping temperatures lower than that of a series engine, with significant impact on heat rejection.
To remedy these shortcomings, InDesA developed a new approach that uses standard physical test procedures to calibrate simulation models based on 1D and 3D representation of fluid flow and heat transfer, outlined in Fig. 2. The simulation is then used to obtain complementary information that can be used to compensate for the uncertainties and lack of accuracy in the early-stage physical engine’s behaviors.
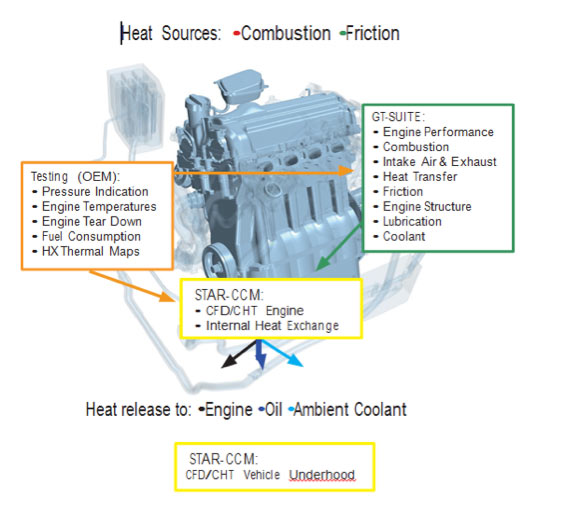 Fig. 2: InDesA’s approach to engine and vehicle underhood thermal simulation.
Physical testing provides comprehensive information about the engine, e.g. combustion pressure, temperatures, friction (tear-down measurements) and fuel consumption, whereas thermal maps of integrated heat exchangers should be tested on separate virtual or physical test benches. These measurements are used to populate and calibrate various 1D engine models in GT-SUITE. The resulting 1D simulations yield predictions for fuel consumption, basic engine operating parameters, mass flow rates, pressure and temperature in the air induction, and exhaust systems and in the coolant and lubrication circuit. This 1D simulation output then provides the boundary conditions for a STAR-CCM+ model of the engine as well as the underhood and full-vehicle environment. This is used to calculate heat exchange inside the engine, through the exhaust and cooling systems, and finally heat rejection to the ambient environment.
Replacing Physical Test Cell with Virtual Underhood Environment
Heat rejection is controlled through thermal management technologies in the engine’s design, exhaust, cooling, lubrication system, and its underhood environment. To virtualize all of these, InDesA used STAR-CCM+ to create a virtual engine. The model was designed to demonstrate thermal simulation techniques with options for different thermal management technologies: split cooling, water-cooled exhaust manifold, engine oil cooler and thermal encapsulation. The virtual engine is brought to life with 1D simulation models from GT-SUITE for engine performance, combustion with air intake and exhaust, heat transfer to the engine structure, lubrication and coolant circuit (shown in Fig. 3).
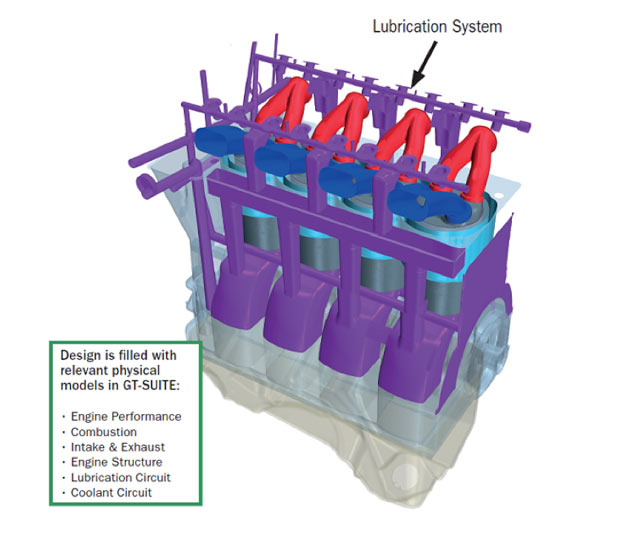 Fig. 3: The virtual engine is “brought to life” with data from GT-SUITE.
Then, to improve on the traditional physical test cell, InDesA developed a virtual car with underhood and full-vehicle environment using STAR-CCM+ that brings together CFD (computational fluid dynamics) and conjugate heat transfer (CHT) models. InDesA’s virtual concept car is named “Pandora.” Clearly, no automotive OEM (original equipment manufacturer) would use this as the brand for a production car, given the devastation associated with Pandora’s Box. On the other hand, according to Greek mythology, Pandora was one of the most beautiful women created by the gods, so the name seems like a good fit.
 Fig. 4: Pandora is a virtual concept car with underhood and full-vehicle environment modeled with STAR-CCM+ to simulate engine thermal performance with heat transfer to the ambient environment.
The Pandora virtual car model is used to simulate engine thermal performance with heat transfer to the engine compartment and ambient environment, demonstrated in Fig. 4. The Pandora model includes the engine and a simplified engine compartment, with air induction, exhaust and coolant systems and front-end heat exchanger module. The goal is to provide greater fidelity together with a wider range of operating conditions than a physical test cell operated typically at decent test cell temperatures, see Fig. 5. Airflow through the engine compartment is modeled in accordance with vehicle speed and cooling fan performance. Air temperature is also modeled in accordance with heat release from the radiator module in front of the engine. The 1D vehicle model, which includes a drive train, road model and ambient environment, is used for transient simulation in GT-SUITE. Hence boundary conditions for any driving cycle from warm-up to racetrack operation can be provided.
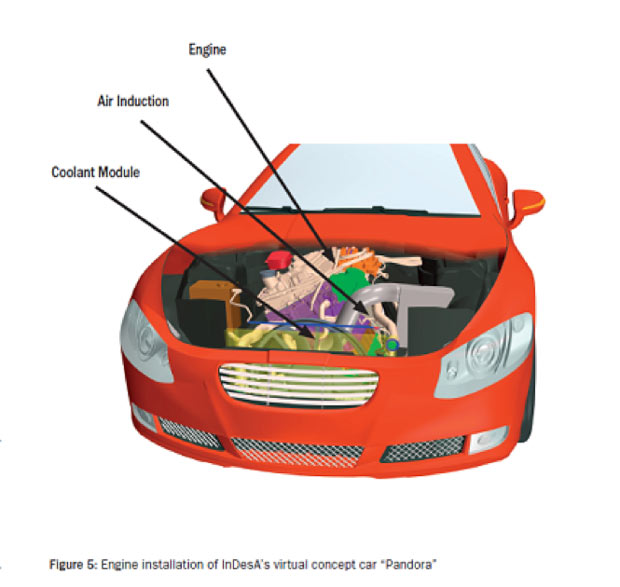 Fig. 5: Engine installation of InDesA’s virtual concept car “Pandora.”
The engine model’s level of details is edited down to make it suitable for thermal stress analysis (see Fig. 6), with heat flux from combustion into the liner, piston, flame deck and exhaust ports. In addition, dissipated frictional heat is added to the engine liner. This allows calculation of internal heat flux, i.e. the heat exchange between the engine structure, coolant and engine oil.
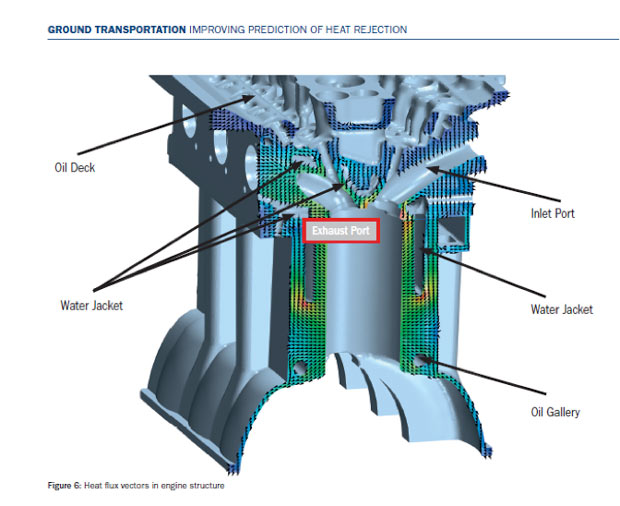 Fig. 6: Heat flux vectors in engine structure.
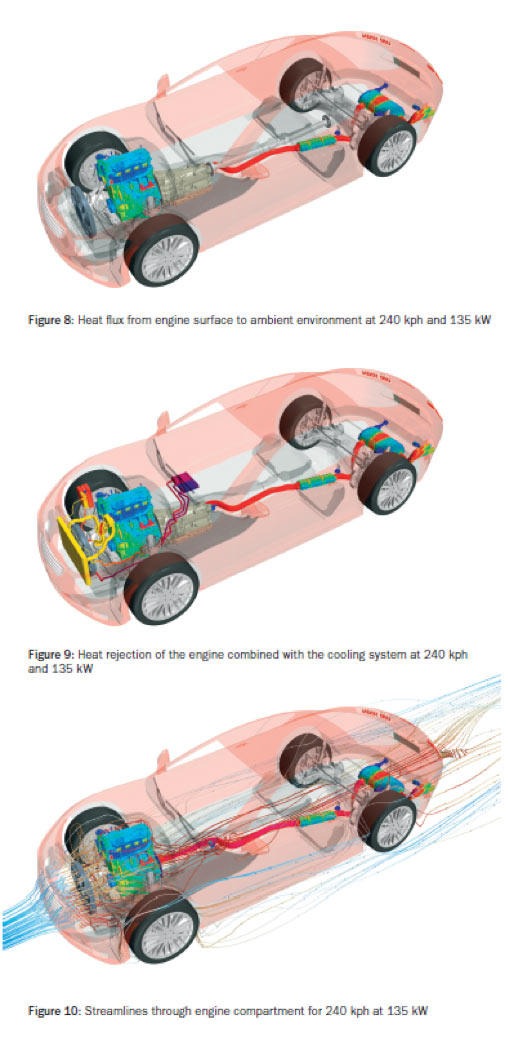
Based on these heat exchanges and 1D simulation models, a unified vehicle model of between 100 to 150 million cells is created in STAR-CCM+, which is used to calculate the heat flux from the engine to the coolant and lubrication system from where it is transported to the heat exchanger pack in the front-end (see Figs. 7 and 8). There the heat is released to the cooling air passing through the heat exchanger and cooling fan, shown in Fig. 9. Therefore, the engine sees the correct underhood air temperature and flow conditions, which is a significant difference to conventional test cell testing.
This integrated STAR-CCM+ simulation model allows various heat sources to be quantified precisely; the breakdown of each is shown in Fig. 10. In the example for a vehicle speed of 240 kph with 135kW engine brake power, 51% of the total combustion heat comes from the combustion chamber, 37% from the water cooled exhaust manifold, and engine friction accounts for 12%. It must be noted that the latter quantity is basically an input from physical testing. The model also reveals heat release to the coolant (79.6%), to the engine oil (14%) and to the ambient environment through the engine surface (5.8%). InDesA notes that due to internal heat fluxes and redistribution, the values revealed by simulation differ from what might be expected based on engineering intuition.
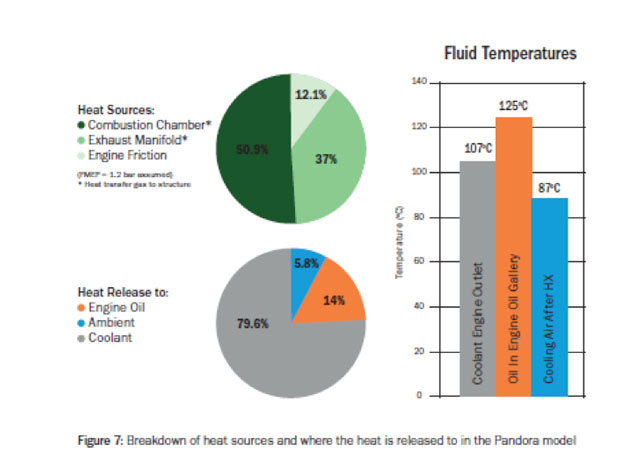 Fig. 7: Heat flux from engine surface to ambient environment at 240 kph and 135 kW.
Engineering intuition would suggest that engine friction is mostly dissipated to the oil. So one would expect to see around 12% of heat release in the oil. Since the oil temperature is significantly higher than the coolant temperature, one might assume the heat is transferred from the oil to the water, at least in the cylinder head. So heat release to the engine oil could be expected to be around 10%. However, we found it to be around 14%. The difference may appear insignificant, but they could affect the decision to add oil coolers or not.
The simulation also gives temperatures for coolant, oil in the oil gallery, and temperature of air after the heat exchanger. These play an important role in the next step — designing the cooling system based on test and simulation results. The vehicle exterior designers must also be included in developing a strategy for air cooling. The earlier the thermal engineer is equipped with good studies, the better he can influence the design to eliminate thermal issues.
Used in combination with bench testing of physical prototypes, InDesA’s virtual approach can predict heat rejection early in engine development with higher fidelity and confidence than bench testing alone. With further development, InDesA believes this methodology has the potential to replace physical prototype heat rejection testing altogether.
More Info:
Subscribe to our FREE magazine, FREE email newsletters or both!
Latest News


