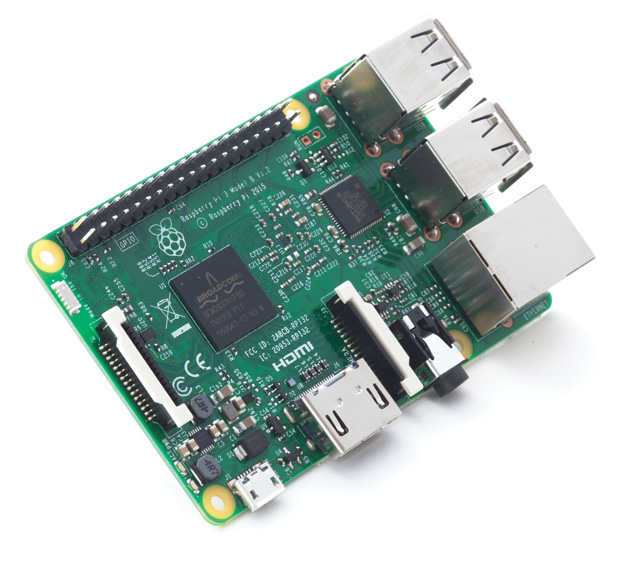
The Raspberry Pi 3 has a 1.2GHz 64-bit quad-core ARMv8 CPU, 802.11n Wireless LAN, Bluetooth 4.1, Bluetooth Low Energy (BLE), 1GB RAM, 4 USB ports, 40 GPIO pins, a full HDMI port Ethernet port, a combined 3.5mm audio jack and composite video, a camera interface, a Display interface, a micro SD card slot and a VideoCore IV 3D graphics core, all in 3.37x2.21x0.83 in. Image courtesy of Raspberry Pi.
Latest News
October 3, 2016
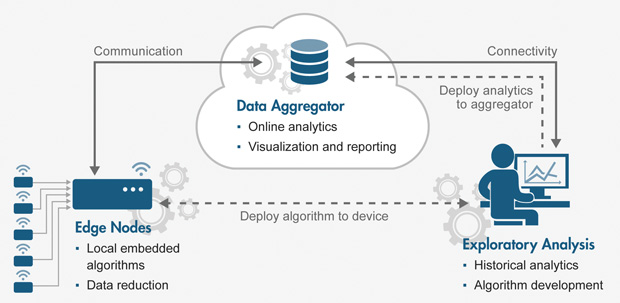 Workflow of an Internet of Things connected device: Stage 1 – edge device (e.g., sensor, switch, optical reader); Stage 2 – local computational and/or data storage resource; Stage 3 – data aggregator resource, generally in a cloud, hosting massive computational and storage capabilities. Two-way communications are possible between any two stages. Image courtesy of MathWorks.
If your business is new to the Internet of Things (IoT)—or if you want to improve the design process of your already-connected products—mathematics software can complement your current engineering tools. Packages from such companies as MathWorks, Maplesoft, PTC and Wolfram Research help users address the full spectrum of designing and operating smart devices. From planning the device (considered the leading “edge” of the IoT operational flow), through programming the operating sequence (i.e., “read temperature every five minutes”), to simulating in real time the expected behavior of an entire IoT control loop, you’ll find there’s a mathematics package that saves both time and money.
The IoT Data Flow
Whether you’re sensing temperature or tidal flows, programming Arduino, Raspberry Pi or custom microcontrollers, sending data to a cloud or fine-tuning a control algorithm, the general path followed is the same. (See the flow diagram on page 20.) A smart edge device (Stage 1) may feature a camera, optical reader, pressure sensor, moisture sensor or simple switch, and is mated with an on-board microprocessor that at a minimum can send or receive data (or both) via USB cable or Wi-Fi to a local server. The physical format can be a totally custom configuration or a system built around such popular embedded platforms as the Arduino microcontroller or Raspberry Pi fully functional computer board. (Go here for some great basic examples).
More sophisticated edge devices contain processing capabilities for data reduction and may perform according to embedded algorithms that can be remotely updated as needed (Stage 2). Depending on your goals for the task, and especially if real-time actions need to be triggered, these devices may also incorporate two-way interactions with powerful, near-user computational/storage resources. This relatively local configuration—designed to perform fast edge analytics, preserve communications bandwidth and reduce latency of critical commands—has come to be known as edge computing or fog computing (a term originated by Cisco and well-explained here).
At the far end of the IoT chain resides Big Data, supported by the tools and algorithms needed for meaningful mathematical analysis, visualization and reporting (Stage 3). This activity primarily happens in the cloud, where massive computational and storage resources support many levels of decision making. Businesses can observe trends in data over multiple parts or systems across hours, days, months or years, making decisions about current operations or future designs based on aggregate behavior. Two-way communications are possible between any pair of stages in the IoT, and each stage involves design and analysis; however, we’ll focus on the role of mathematical software in designing and simulating all aspects of edge devices for Stage 1.
Begin at the Beginning
Though it’s easy to think that a smart device begins its life as a CAD drawing on a screen or paper, it really starts with the math behind the process—the mathematical concepts that need to be proven first then implemented in hardware and software designs. This is the broad viewpoint of CAD supported by PTC’s MathCAD software.
“We like to talk about showing your work: That all designs start from critical values and calculations that define a system,” says Andrew McGough, product manager at PTC. “From an IoT perspective, we not only focus on defining sensors themselves—what you need and don’t need—but also where they need to go and how you use that data.” PTC is working on a number of initiatives to see how their products fit well in the smart-connected world.One example McGough presents is that of a bike being outfitted with smart sensors. (See “Smart Mountain Bike Tells All” on page 20.) “You might want to get specific information to drive the constant design modifications or to drive simulations,” he explains. “You want to know where to put the sensors on the bike to get the best result and what you need information for. It may be you can sense 10 different things, but you only need two; adding too many sensors to the bike can be intrusive to the system (changes the bike handling). You can use MathCAD design of experiments (DoE) to determine the best fit for what sensors you need and the absolute values.” McGough adds that you may not even need gauges and readings for all of the parameters you’d like to have—pick two and use MathCAD to calculate the desired end values from the raw data.
Greg Brown, PTC senior director for CAD Business Development, expands on this concept with a different industrial use of MathCAD’s capabilities. “Using accelerometers to detect and monitor vibration in rotating machinery, or any machinery, has been around for many years,” comments Brown. Now, he says, connecting them for feedback in a digital way is interesting because you can monitor lots of different vibrations in different parts of the system. “This is another application of robust design and DoE where you’ve got huge amounts of data—real data—that tend to be very noisy compared to the theoretical data you get out of an FEA (finite element analysis) system. You can characterize a structure in FEA, and get nice smooth harmonics and look at where you would put sensors based on that, but in reality there’s a lot more complexity to it.” He says because sensors themselves give noisy data, “You might need a lot of filtering and number crunching after the fact to work out where is the most robust place to put them.”
Programming with MathWorks
A little background about programming a microprocessor-controlled smart device: If you do it directly, you must create state machines to control its actions, explicitly defining all inputs, outputs and timing, usually writing in C or C++. This produces the guaranteed fastest executions because there is no operating system involved. However it can be a very complex task, especially for newcomers.
MathWorks gets this, and is heavily into helping users simplify code generation. In fact, its website introduces Arduino programming support with this statement: “Arduino programming is supposed to be fun but can become frustrating and time consuming for tasks such as plotting sensor data or incorporating advanced math, signal processing or controls routines into your projects.” By offering special support packages for MathWorks MATLAB and MathWorks Simulink software products, the company addresses challenges for both Arduino and Raspberry Pi programming, supporting two primary workflows: Read/write/analyze data from sensors and imaging devices, and develop algorithms that run standalone on these devices.
MATLAB is a high-level interpreted language, so no compiling is necessary. Eric Wetjen, MathWorks senior product marketing manager, says the MATLAB Support Packages for Arduino and Raspberry Pi (introduced in the MATLAB 2014a release) make programming edge devices much easier for any level of programmer or engineer. “With either MATLAB Support Package,” he explains, “users write a script in MATLAB, using functions specific to the support package; that allows you to directly access [for example] the Arduino and anything attached to it, like an I2C or SPI bus temperature sensor.” With this workflow, MATLAB is open and running on your PC or Mac, and the computations are done on the desktop in real time; you can also go back to analyze and visualize the data in MATLAB. The board and computer are always communicating, either via USB cable or by Wi-Fi—the latter if you add a Wi-Fi shield (daughter board) to the Arduino or Raspberry Pi.
 The Raspberry Pi 3 has a 1.2GHz 64-bit quad-core ARMv8 CPU, 802.11n Wireless LAN, Bluetooth 4.1, Bluetooth Low Energy (BLE), 1GB RAM, 4 USB ports, 40 GPIO pins, a full HDMI port Ethernet port, a combined 3.5mm audio jack and composite video, a camera interface, a Display interface, a micro SD card slot and a VideoCore IV 3D graphics core, all in 3.37x2.21x0.83 in. Image courtesy of Raspberry Pi.
When working instead in the MathWorks Simulink environment, you use its block-diagram approach to model a system and create complex control algorithms then deploy the algorithm you’ve written right onto the Raspberry Pi or Arduino. “The Simulink Support Package generates the code for you and downloads it to the board; the advantage is you can then do stand-alone operation, with the board disconnected from Simulink,” Wetjen notes. The device sends data wherever you want, such as to a cloud server. From there, you could again use MATLAB, this time to access the data for analysis.
MATLAB also provides a great starting point if you have a brand-new sensor in development. “You can connect it up, see how the data looks, start applying some analysis and characterize the behavior. When you’re satisfied, then you can write code for the device to operate autonomously,” Wetjen points out.
Maplesoft
MapleSim software from Maplesoft has always been about building models of devices and systems. Laurent Bernardin, chief scientist at Maplesoft, says that their customers use their products to simulate device behavior and get insight for optimization, seeing where perhaps a device would have problems and fixing it ahead of time. “In the context of the Internet of Things,” he observes, “this is becoming important because you have all these devices that are connected and you get a constant stream of data on how those devices are behaving.”
 MapleSim is an advanced system-level modeling and simulation tool that provides insight into system behavior, making it helpful with the Internet of Things design process. Image courtesy of Maplesoft.
Bernardin adds: “We have, for example, a customer who is monitoring thousands of power plants around the world. The connected devices are generating data about how the individual parts are doing, and the goal is to detect failure before it becomes an issue. They are using mathematical simulation models in Maple and MapleSim to compare the data they gather in the field to the expected behavior that the simulation model is giving. That allows them to detect when things deviate from the normal and to predict in advance when a particular part is going to fail.”
In another way of working with MapleSim, the user connects a physical device to a virtual device, and can compare the actual sensor readings to the expected readings from the model. Bernardin calls this the virtual Internet of Things, because the model has mixed virtual, simulated devices with hardware-in-the-loop. The approach lets you predict, compare and validate, incorporating an accurate mathematical model that stands in place for your devices.
An added benefit, notes Bernardin, is that as you develop a network involving IoT devices, you may want to deploy the complete system while you’re still proving out a particular component. A virtual device, based on a simulation model, can be a placeholder for the missing device until it is ready.
One additional MapleSim feature that is relevant to working with edge devices is the ability to generate high fidelity models that still run in real time. This is crucial for comparing the sensor data to the model as it comes in; you can’t fall behind because the devices send so much data on a continuous basis. Bernardin says MapleSim is rather unique in its ability to generate these real-time models for very complex systems where other tools might require you to compromise on fidelity. Although tempting to handle this task with one’s standard FEA and CFD (computational fluid dynamics) simulation tools, those tools are not able to keep up with IoT data streams and do not allow a system-level view.
Wolfram Research
Wolfram Research sometimes seems to be in a world of its own, but its variety of tools offer convenient stepping stones to developing and using interconnected devices. The Wolfram Data Drop is an open service that helps users get data from hardware ports/sensors, accumulate that data in databins in the Wolfram Cloud, and access it from Wolfram Language and other systems. For example, you can use the Wolfram Language Device Connection for Arduino or the bundled Wolfram Language system on Raspberry Pi to read data and add it to a databin. The company’s website also says the option to add embedded code to a databin is coming soon.
Beyond Edge
Each of these math-oriented companies also markets software that helps designers with Stages 2 and 3 along the IoT path. For example, MathWorks offers an option for storing data with the free ThingSpeak data aggregation service, where you can analyze it online using the integrated MATLAB engine or offline with a desktop installation. You can also access data with the MathWorks Signal Processing Toolbox and Statistics and Machine Learning Toolbox for filtering and sampling data, applying statistics and doing further big data analysis.
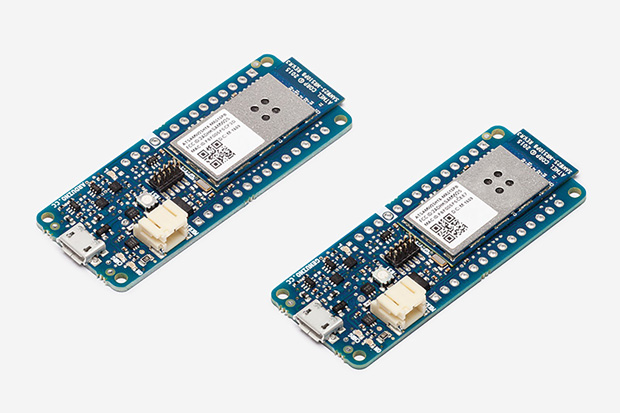 Arduino markets its MKR1000 (US only) and Genuino MKR1000 (outside US) as an ideal solution for IoT projects by those new to networking. Image courtesy of Arduino.
PTC’s ThingWorx platform includes development, connectivity and data analysis tools that complement MathCAD, and the new statistical analysis and visualization tools in Maplesoft’s Maple 2016 provide expanded insight into more Big Data from the edge.
More Info
Subscribe to our FREE magazine, FREE email newsletters or both!
Latest News
About the Author
Pamela Waterman worked as Digital Engineering’s contributing editor for two decades. Contact her via .(JavaScript must be enabled to view this email address).
Follow DE

