


Latest News
February 1, 2018
Technology Drives the Auto Experience
Room for Improvement
44% of survey respondents were “very satisified” with their car’s infotainment systems, which routinely rank as the least satisfying automotive feature in the survey.
— Consumer Reports subscriber survey, August 2017
Computing and Commuting
Nearly all consumers who had familiarity with replicating their smartphone system onto an in-vehicle display indicated they were interested or somewhat interested in having this feature in their next new vehicle.
— “2017 Automotive Connected Services and Apps Consumer Analysis,” IHS Markit, June 2017
Sounding Off

More than half of respondents preferred to have a brand name car audio system in their next new vehicle. Among these, 81% indicated that it would influence their vehicle purchase decision and 53% wanted one to be standard on their vehicle.
— “2017 Automotive Premium Audio Consumer Analysis,” IHS Markit, August 2017
Back-Seat Movie Watchers
Of all in-car technologies, consumers in the U.S. were most likely to pay for a rear-seat entertainment system, indicating they’d be willing to pay an additional $640 for it.
— “2017 Automotive Connected Services and Apps Consumer Analysis,” IHS Markit, June 2017
 The Future Interface?
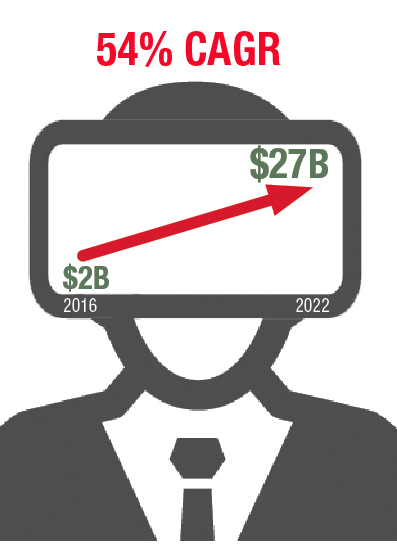
The global virtual reality market size was valued at $2.02 billion in 2016 and is expected to reach $26.89 billion by 2022 with a compound annual growth rate of 54.01% between 2017 and 2022.
— “VR Market by Hardware and Software,” Zion Market Research, November 2017
$3,000,000,000
Augmented reality and virtual reality broke investment records in 2017 with startups raising over $3 billion.
— Digi-Capital, January 2018
2,000
Apple says 2,000 apps are using its augmented reality software, ARkit, which was rolled out with iOS11 in September 2017.
— Apple, January 2018
Speaking to Speakers: The New UI
Look Who’s Talking
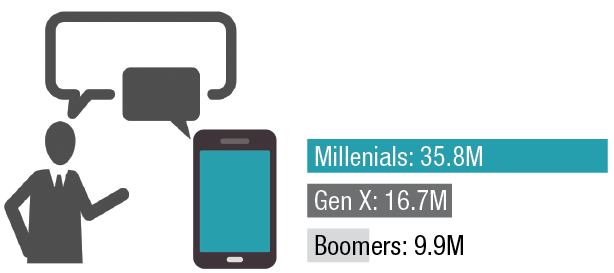
In 2018, 38.5 million millenials are expected to use voice-enabled digital assistants—such as Amazon Alexa, Apple Siri, Google Now and Microsoft Cortana—at least once a month.
— eMarketer, April 2017
175 Million
Smart devices will be installed in a majority of U.S. households by 2022 (55%), with more than 70 million households having at least one smart speaker in their home. The total number of installed devices will top 175 million.
— “Digital Voice Assistants Platforms, Revenues & Opportunities 2017-2022,” Juniper Research, November 2017.
22 Million
Amazon sold over 11 million Alexa voice-controlled Amazon Echo devices in 2016, a number that was expected to double for 2017.
— “Smart Home Devices Forecast, 2017 to 2022 (US),” Forrester Research, October 2017
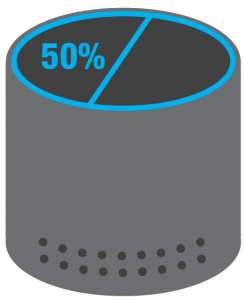
50%
Smart speakers were expected to make up half of the total installed base of smart home devices in 2017, reaching 68% by 2022.
— “Smart Home Devices Forecast, 2017 to 2022 (US),” Forrester Research, October 2017
70.6%
Amazon Echo accounted for 70.6% of all voice-enabled speaker users in the U.S. in 2017, followed by Google Home at 23.8%.
— eMarketer, April 2017
56.3 Million
The growing smart speaker market is expected to hit to 56.3 million shipments, globally, in 2018.
— Canalys Research, January 2018
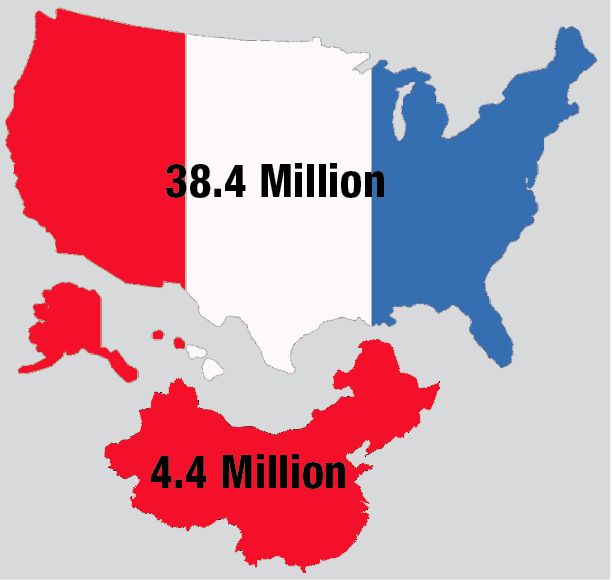
The US will remain the most important market for smart speakers in 2018, with shipments expected to reach 38.4 million units. China is a distant second at 4.4 million units.
— Canalys Research, January 2018
Subscribe to our FREE magazine, FREE email newsletters or both!
Latest News
About the Author
DE’s editors contribute news and new product announcements to Digital Engineering.
Press releases may be sent to them via [email protected].


