

Latest News
September 1, 2013
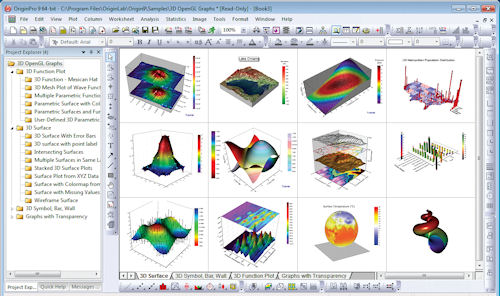 Fig. 1: Origin provides example projects with sample graphs and analysis. Projects include instructions for creating graphs and modifying analysis settings. |
An x.x is considered a minor release. “Although we call it minor, there are usually many, many features that we add,” he says. The x.0 version is a major release. “A major release is something where we feel we have invested quite a bit of time and implemented something new that significantly changes the product,” he says.
As an example, Iyer cites the Auto Update feature introduced in Origin 8. “If you change the input data, all the output will automatically update—allowing you to perform tasks more efficiently, and even perform batch processing using what we call an Analysis Template,” he says. This makes Origin 8 markedly different than the previous 7 version.
Carrying Technology Forward
For Origin software, the capabilities grow with each minor and major revision. “We don’t eliminate features. Typically, we enhance them or add new ones,” explains Iyer. While this adds to the complexity, OriginLab offers many tools in Origin to help users understand the capabilities of earlier versions, as well as the new features in the latest version.
“One of the things we do is publish many movies,” Iyer says, noting that more than 100 video tutorials are easily accessible from a link on OriginLab’s homepage. But users can get up to speed or get refresher information directly in Origin, too.
In addition to the helpful learning/teaching tools and the built-in explanations, OriginLab provides additional help through training courses for Origin 9 that could provide even greater use of the newest software.
Compelling Enhancements
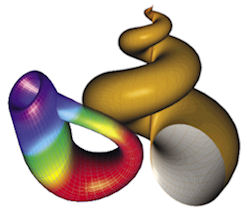 Fig. 2: The OpenGL 3D parametric function plot allows the generation of complex shapes such as a Klein bottle (left) and seashell (right) in Origin 9.0. |
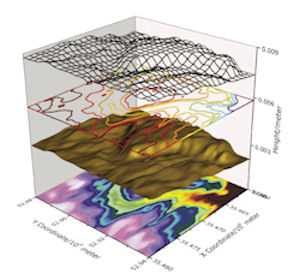 Fig. 3: Stacked surfaces are easily viewed from many perspectives in Origin 9. |
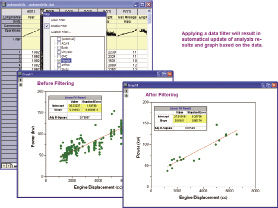 Fig. 4: A data filter applied to a collection of automotive data allows the selection of a single make without showing the other data. Any analysis automatically updates. |
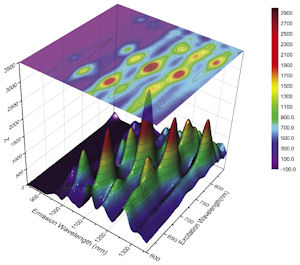 Fig. 5: Locating a 3D surface is one of the tricks that users can do with the animation capability of Origin 9. |
As a major revision, Origin 9 has more than a dozen significant enhancements. What sets it apart is mainly enhanced 3D graphing. Compared to Origin 8, the ultrafast 3D graphing in Origin 9 ranges from 17 to as much as 340 times faster in certain tasks. The reason for the improved performance is OpenGL (open graphics library), a standard library that many other products use.
“All 3D graphs used to be based on Windows drawing core, Windows GDI (graphics device interface), and that was rather slow and did not have modern options such as lighting effects,” says Iyer. “What we did in version 9 is to revamp our 3D to use OpenGL. That makes things a whole lot faster.” (See Fig. 1.)
Today, graphics cards come with OpenGL capability and are fine-tuned for handling OpenGL graphing. Updating the driver allows users to keep up with the latest OpenGL capability. “So it really takes advantage of the graphic card’s capability, as well as in providing better performance for 3D graphics,” says Iyer.
The 3D parametric function plot is another major new graphing feature. “That allows customers to put in an equation and create complex 3D plots from a function,” says Iyer. (See Fig. 2.)
Iyer notes that a significant fraction of OriginLab’s customers use 3D, and bringing in large volumes of data and being able to make a quick surface plot is important to them. As seen in Fig. 3, users can now stack multiple surfaces and quickly view the data from many angles, and zoom in and pan in the program.
More Features
There are many other new features in Origin 9 beyond its 3D graphing capabilities, of course. The data filter is one example. “If you have many columns of engineering data, you can quickly reduce that data by putting conditions on columns,” explains Iyer. (See Fig. 4.)
With Origin 9, users even have a movie creation capability to animate their data (see Fig. 5). “That’s pretty significant, and it is slowly catching up to customers,” says Iyer. “Say they have multi-column data and they want to graph one column at a time and keep changing it, so they can see the trend in the data, or it can be some 3D surface.
“We recently had an engineering customer that studied temperature variations inside a furnace, and they wanted to simulate how the temperature changes over time and make a movie of it,” he continues. Even with the improved 3D graphing capability, he adds, the 3D capability in animation is much better than 3D graphing: “It allows looking at almost real-time 3D data as a movie.”
A table of key features by version on the company’s website shows the numerous changes from Origin 7.5 through Origin 8.0, 8.1, 8.5, 8.5.1 and 8.6 vs. Origin 9 for the Origin Interface, graph types, graph customization, gadgets, importing, exporting, data manipulation and more.
“We really bent over backward to add more features to the product,” Iyer says.
Time for a Change?
Origin has historically been viewed as a high reliability graphing product. Starting with version 8, the analysis advanced in several areas, including statistics. “We are seeing more and more users migrating to Origin to tap into its analysis capabilities,” Iyer observes.
Combined with the superior graphing capabilities of Origin 9, the analysis could provide the compelling requirement threshold for new users. Easily customized workbooks, introduced in Origin 8, allow users a similar feature to Microsoft Excel. “But it has much more capabilities in terms of housing metadata in the book and being able to manipulate the data, analyze the data, graph it and then combine everything together to make a nice free-flowing document, which can then be exported as a PDF or image file,” explains Iyer.
OriginLab’s customer base is rather broad; it distributes software products worldwide, with German and Japanese versions as well as the English version.
Who is a potential user of Origin? “Typically, any scientist or engineer who is frustrated with Excel,” says Iyer. “Anyone who is looking for a better graphing capability, a better analysis capability.”
Randy Frank is a contributor to DE. Send e-mail about this article to [email protected].
More Info
Subscribe to our FREE magazine, FREE email newsletters or both!
Latest News
About the Author
Randy FrankRandy Frank is a freelance technology writer based in Arizona. Contact him via [email protected].
Follow DE

