

December 10, 2007
By Barb Schmitz
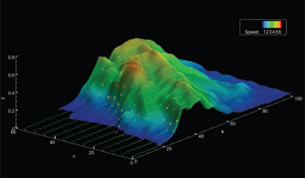 Figure 1: This is a plot of surface wind flow over ranges near Adelaide, Australia. Note the stronger windson the lee face (foreground) and lighter winds on the windward slopes (background). |
Wind shear is an unpredictable and violent weather phenomenon that results when opposing squall lines of high-velocity winds cross paths or collide. The result is a whirlwind — a mini-tornado of sorts — in which wildly thrashing air currents can throw even huge aircraft out of control when they are flying at relatively low landing speeds. When landing, there is little time for a pilot to recover from unexpected buffeting from winds, and obstacles on the ground are often perilously close.
While wind-shear detection has helped make commercial airline flight safer over the last decade, the technology is not common on smaller planes. In the beginning of August of this year, two people were killed in Australia when their twin-engine Aero Commander 500 aircraft crashed into a hillside. Wind shear is believed to have been the cause of that crash.
Wind shear and turbulence are often generated by mountain waves, a wavelike effect characterized by severe updrafts and downdrafts that occur when rapidly flowing air encounters the steep front of a mountain or hillside. Such treacherous wind patterns can also put the lives of unaware firefighters into great peril. With the help of new technology, researchers are looking closer at such wind patterns in an effort to help pilots, marine craft operations, and firefighters avoid putting themselves and others at risk.
Researchers at the Grace Research Network in Adelaide, Australia, are using Tecplot and O-Matrix software to study the complex phenomena of wind shears and turbulence in Australia. The Grace Research Network is an Australian research organization that provides environmental studies and data modeling services to government agencies in Australia as well as to private agricultural and chemical companies.
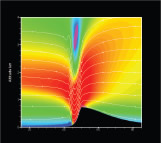 Figure 2: 2D view showing variation in wind speeds caused by a model hill. Purple patchesnear top and bottom show turbulence areas. |
Warwick Grace, Ph.D., a meteorologist, is the company’s principal scientist. He uses plotting software such as these two visualization solutions from Tecplot, Inc., of Bellevue, WA, to help him understand the complex data generated in his research as well as to communicate the results of this research to the company’s clients.
Tecplot Helps See What Cannot Be Seen
To help him better understand such wind phenomena, Grace used a mesoscale meteorological model coded in O-Matrix, an integrated analysis environment used for analyzing data and creating simulations. He used data collected during field experiments flying a specially instrumented and ruggedized motorized glider in conjunction with a series of balloons that were tracked by radar. He also used measurements collected by recently installed Doppler radar, which measures wind speeds at all altitudes.
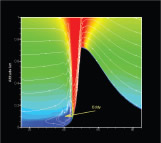 Figure 3:Wind speed and streamtraces of flow over lee slopes of a model hill. Closeup viewshows a reverse eddy in the lee. |
Grace used a Gateway computer with a Celeron 2.4GHz processor with 768MB RAM and an NVIDIA GeForce2 graphics processor to generate the model. All of this data generated by the model was then transferred into Tecplot for visualization on an LG LCD 19-inch Flatron monitor. The resulting plot (see Figure 2) represents a vertical slice of the modeled wind flow over a small mountain.
The plot shows a jump-like feature where the wind speed picks up immediately after crossing the top of the mountain, flowing sharply down and then back up on the leeside of the mountain. The wind speeds are color coded with the strongest winds indicated by red. The blue indicates air with little mean motion, however it is not necessarily calm as it could be filled with lots of eddies and counter-eddies. The lines are streamlines, indicating direction. The rapid change from down motion to up motion has obvious implications for aircraft that are approaching landings. The plot also illustrates the extreme turbulence (denoted in purple) above the jump as well as at the low-level eddy showing backflow.
“The wind shear and turbulence associated with this type of wind flow is hazardous to aircraft,” says Grace, “however, if it can be anticipated, pilots can avoid it. For example, with an inversion, the area of turbulence can be located within the flight path to the local airports.”
Grace also modeled the wind flow over the Adelaide Plains and MountLofty ranges (see Figure 1). The resulting plot shows the variation in wind speed over the foothills and the plains. This plot also shows the 3D view of near-surface wind flow.
“On near-shore waters where the ranges meet the sea, the effect of the hills is to increase the wind strength rather than to act as a shelter as marine craft users —especially inexperienced users new to the area — might expect,” says Grace. “For local bushfire fighters, a knowledge of the wind behavior helps in the planning of their operations. For all those potentially affected, ‘forewarned is forearmed.’ ”
The plots created with O-Matrix and Tecplot software enabled Grace to understand phenomena that are not evident to the human eye. “By being able to stretch the z axis and insert streamtraces, I was able to identify the presence of a reverse eddy,” says Grace. “This is observational evidence for this feature, but it was unexpected that the model would be able to simulate it.” The eddy is evident in a closeup of the vertical plot (see Figure 3).
Tecplot as a Communication Tool
Grace, who uses Tecplot to create both 2D and 3D plots, says the plots are a “vital part of communicating aspects of the environment” to his clients. The plots in this particular study are being used to assist marine and aircraft operators as well as firefighters.
Such analysis and visualization has led air traffic controllers at certain airports to avoid “stacking” aircraft in turbulent areas. Instead, aircraft will be rerouted to use a different flight path and landing runway. And local weather forecasters can access the results of the model from an archive of prerun model outputs, and so provide better weather forecasts to the aviators.
Another practical use of such visualizations is that firefighters will not attempt a backburn or to deploy to an area where eddies are likely.
The use of Tecplot software facilitates the research efforts at Grace Research in many ways. “Tecplot data visualization lets me know if the models that I develop are realistic,” says Grace. “It allows me to identify and communicate the features that the client needs to be aware of and to heed.”
Tecplot’s three greatest strengths, according to Grace, are its link to O-Matrix; its interactive flexibility once a plot is created; and its streamtraces feature. “With Tecplot, I can create and export good visualizations from actual data or model data that suits my clients,” says Grace.
More Information
Grace Research Network
Adelaide, Australia
graceresearch.com
Tecplot, Inc.
Bellevue, WA
tecplot.com
Barb Schmitz is a freelance technical writer and public relations consultant with more than 10 years of experience working as an editor for a technical trade magazine. She has written extensively on a wide range of design engineering topics. Send your feedback about this article through e-mail c/o DE-Editorsmailto:[email protected].
Subscribe to our FREE magazine, FREE email newsletters or both!
About the Author
DE’s editors contribute news and new product announcements to Digital Engineering.
Press releases may be sent to them via [email protected].


