

Latest News
December 3, 2007
By Tom Peters
For those who are not HALT/HASS (highly accelerated life test/highly accelerated stress screening) experts and are surveying the market for the best value in HALT/HASS chambers for the first time, the industry is full of bewildering and confusing claims.
• 100°C/minute ramp rate
• 100Grms table vibration
• x,y,z ratio of <x, PSD (power spectral density) plots
• Highly damped segmented table vs. “rigid” table
• Humidity in a HALT chamber
The following information should help clarify the specifications used in HALT/HASS chambers.
The goal of HALT/HASS is to subject a product to cold-step stress, hot-step stress, rapid thermal cycles, six degrees of freedom (DOF) vibration at ambient temperature, and rapid thermal cycles combined simultaneously with vibration — all the time while subjecting the device under test (DUT) to produce specific stresses and to encourage product breakage.
 Figure 1: Turbulent airflow extracts the greatest BTU change rate on a product. |
To the uninitiated, or those raised in the ED (electrodynamics) industry, on the surface more seems to be better. But as Alice found out, things are not always as they seem, nor useful in real-life testing.
Temperature ramp rate
There are claims anywhere from 50°C per minute to 100°C/min. This specification can be based on just air temperature change or can be based on some designated mass. In the application of HALT/ HASS, product response is always the key metric. In other words, the chamber must be able to move the product temperature at a very high rate of change in order to detect weaknesses in a compressed time environment.
HALT chambers are built much differently than a standard thermal humidity chamber.
The typical air velocity in a standard thermal humidity chamber is around 400 to 700 feet per minute (fpm). The airflow in high-performance HALT chambers is around 4,000fpm. This difference in airflow is crucial to the thermal ramp rate performance of the chamber, but does not tell the whole story. The air management system is also key to the thermal performance of a chamber. The air velocity must be turbulent airflow in order to extract the greatest BTU change rate on a product. In other words, the air boundary layer on the components and assemblies must be overcome in order to change product temperatures rapidly as required in HALT/HASS processes (see Figure 1).
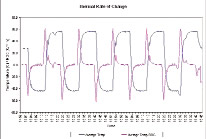 Figure 2: The typical velocity in a standard thermal humidity chamber is around 400fpm to 700fpm, whereas the air velocity in high-performance,purpose-built HALT chambers approaches 4,000fpm. |
The only way to get the needed thermal change rates is with a purpose-built HALT/HASS chamber. A unit with mechanical refrigeration and LN2 boost cannot attain the needed product ramp rates. A specification that would be useful in order to make valid chamber comparisons would be one that is based on a mass that closely represents the product to be tested. Since most chambers are designed to address a broad segment of the electronic and electromechanical industries, a ramp rate specification based on a mass similar to an electronic product may be more germane to the actual use of a HALT/HASS chamber. This information would allow a more accurate judgment of the thermal capabilities of the various chambers as it applies to the actual use of the chamber.
Figure 2 shows the average rapid thermal response of 18 thermocouples on an electronic product. The red line is the rate of change of the averaged thermal response. This graph demonstrates that the product is experiencing ≈ 60°C/min. thermal rate of change in both the hot and cold directions.
In order for a chamber to provide rapid thermal response, it not only needs high velocity airflow, but must have a plenum and ducting to maximize that airflow on the product.
Air management is a consideration for thermal performance. Some chambers are more efficient than others in transferring BTU to the DUT. By comparing the thermal ramp rate and the utility required to achieve that ramp rate, it is possible to quickly identify those chambers that are going to cost more to operate than others. For example, Qualmark’s Typhoon 4.0 has a rated ramp rate of 70C°/min and is able to achieve that performance with 100A service. Other comparable chambers on the market require 160A to achieve the similar ramp rates.
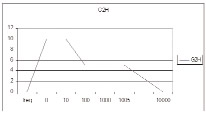 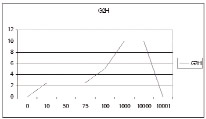 Figures 3a and 3b: The two graphs above both represent a Grms value of 30Grms. However, the energy distribution is very different.An infinite variety of PSDs can represent a given Grms value. A simple Grms specificationdoes not provide any useful information on the PSD. |
100G Table Vibration
Random vibration specifications are the most confusing of any specification published for HALT/HASS chambers. The following should help clarify some of the information published in the specification sheets of chambers.
The maximum vibration of the system is usually expressed in units of Grms. This value represents the RMS value of the acceleration of the vibration system at maximum control set point over some defined frequency band. This is usually based on an unloaded table and is useful only for an empty table. The truth is this specification has no useful information contained in it because the maximum Grms value will change with a loaded table.
The Grms value does not give information as to the energy distribution or consistency within the specified frequency range on a loaded table. This is data that is needed to properly evaluate a vibration system (see Figures 3a and 3b).
PSD Explained
In an ED vibration system the amplitude and intensity is controlled by the user at each frequency so it is possible to have a vibration profile, commonly called a power spectral density (PSD) plot that is flat across a given frequency band. In an RS system the frequency vs. intensity relationship is fixed by the vibration system design and is not adjustable or controllable by the operator. Only the overall intensity is controlled by the user (see Figure 4).
At first this might seem a detriment to the RS vibration system, but it actually has a specific purpose. ED systems are used to simulate end-user environments and to test to a specification. RS systems are designed to stimulate failures, with the main purpose of exciting all the resonances in a DUT to induce fatigue and failure in the weakest links in a product. Electronic and electromechanical products typically have resonances from a few hundred Hertz for discrete components such as transformers, heat sinks, torroids, etc. to more than 4,000Hz for surface-mount technology (SMT) components. For a vibration system to be effective, it must produce excitation across a broad spectrum of frequencies — ideally from 10Hz to greater than 5,000Hz.
In some cases, systems exhibit picket fencing. Picket fencing aptly describes the PSD appearance in that the energy has large gaps in the frequency spectra that have very little energy. This can happen on poorly designed systems and can also occur on systems that are dependent on pneumatic modulation in order to get good frequency distribution when they are run near maximum vibration levels. Again, a Grms specification has no way of detailing the energy consistency.
A study of three different table designs has shown that it is easy to see that an xLF system (mulit-axis vibration system) has much greater low-frequency energy than the other two table designs as well as greater overall energy. To weaken the product, the vibration system must have good energy output at both the low and high end of the frequency spectrum as noted by the xLF table output.
The fixture used to couple the product to the table is the key to getting successful test results. A poor fixture will attenuate frequency bands coupled to the product causing some product weaknesses to be missed. The type of fixture design used on an ED vibration system should not be used on an RS table.
A useful vibration specification would provide the maximum useful Grms value with a given pound load on the table; the frequency vs. energy consistency across a given bandwidth; the flatness of the PSD in the most useful frequency band; and the energy in frequency bands so that an energy distribution profile can be determined.
PSD plots taken on a single point basis on a vibration table do not provide useful information. The table has pneumatic hammers mounted underneath and, depending on how close or far the attachment point is from the hammer, the PSD/Grms value will vary. The proper way to map a table is with a test fixture that emulates a product fixtured over a table area. Dell Computer, in conjunction with QualMark Corp., has developed just such a device designed to be used with any vibration table.
A vibration system with a spec of 100Grms does not give an indication of the figure of merit of the energy of the table. A vibration system with 50Grms with good consistent energy across the frequency band of 10Hz to 5,000Hz will be better at finding product deficiencies than a vibration system with 100Grms but does not have good energy consistency and energy dispersion across the 10Hz to 5,000Hz band.
Again, this is usually specified on an empty table. It is more informative if it is specified on a loaded table.
Vibration consistency across all axes
Ideally a table will have fairly equal energy in each of the three axis vectors. RS tables are mounted on isolation springs and the mounting location is the pivot point of the table. Remember this is not an ED system that only has motion in the single axis. The RS table has motion in the x,y,z axes as well as pitch, roll, and yaw rotational energies about the orthogonal axes.
The ratio of x and y to z will vary with the height above the table and with load. Again the specification does not indicate what the product will experience in each of the axes. Think of the RS table as the hull of a sailboat and the mast the distance above the table. The product configuration and fixture determine how far above the table surface the product will be mounted. It is easy to visualize that the higher a product is mounted over the table, the greater its x and y motion will be relative to the table surface. If the x, y, and z ratios are expressed at a set distance above the table surface, the findings will be more accurate if the DUT is fixed at the same height. The fixture will greatly affect the actual energy in each axis that the product will experience.
Dampened, segmented, rigid table
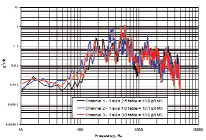 Figure 4: In a RS system the frequency vs intensity relationship is fixedby the vibration system design and is not adjustable or controllable. |
In today’s market there are two basic types of tables. There’s the segmented table, which was only manufactured by one company, and variations of the “rigid” table. Ten years ago the normal rigid table was about five inches thick and was indeed very rigid. The majority of the energy distribution at that time was at the higher frequencies. If one looks at the evolution of table technology at Qualmark, it’s easy to see that the early HP (high-performance) design did a good job of finding faults but missed some of those at the lower resonant frequencies. The segmented table worked well on early electronic products with large components that had lower resonant frequencies. Now there’s “semi-rigid” table construction. This design has enhanced low-frequency energy as well as high-frequency energy to excite the resonances in today’s electronic products constructed using discrete and SMT construction. The broad spectrum and consistent energy produced by the semi-rigid table is extremely effective in precipitating product weaknesses.
Humidity in a HALT chamber
People often wonder why HALT chambers don’t have humidity capability like standard temperature humidity chambers. There are a couple of reasons. The high performance HALT chambers are direct injection chambers. The liquid nitrogen is injected into the chamber plenum through spray nozzles that convert the liquid to gas. This phase change is what produces the large BTU cooling capability of the chamber. If the chamber were to use controlled humidity, the first time the chamber started a cooling cycle two things would happen. Any moisture in the chamber would immediately turn to ice, and any moisture in the chamber atmosphere would be immediately displaced by the dry nitrogen gas.
Another reason is that the typical HALT test is of short time duration. The typical humidity test is of a much longer duration, on the order of multiple weeks or months, and run at steady state conditions. In HALT, the environmental thermal and vibration stresses are constantly varied.
The majority of failures in the field are caused by thermal and vibration stresses. This is why the HALT process concentrates on these stresses and provides the best ROI.
The specifications usually supplied by a HALT/HASS chamber vendor are not sufficient in detail to allow proper evaluation of a system. Detailed information must be obtained, PSD data interpreted, and the idiosyncrasies of RS style tables understood in order to select the proper chamber and vendor to get optimum results from the HALT/HASS process.
References:
Neill Doertenbach, The Calculation of Grms,
Qualmark Corp., 11/16/2003.
Tom Peters, a senior applications engineer at Qualmark, has 38 years of experience in instrumentation. The resident expert in HALT and HASS testing, Peters has been involved with it for six years. Send comments about this article to DE-Editorsmailto:[email protected].
Subscribe to our FREE magazine, FREE email newsletters or both!
Latest News
About the Author
DE’s editors contribute news and new product announcements to Digital Engineering.
Press releases may be sent to them via [email protected].


