

Latest News
June 30, 2009
By Vince Adams
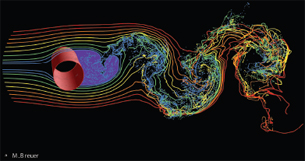 Figure 1: CFD Results of Flow Separation Behind a Cylinder. Image Courtesy of Tecplot Inc. and M. Breuer, Department of Fluid Mechanics, Helmut-Schmidt University Hamburg. |
In any simulation, obtaining accurate results is only half the battle. Whether the domain is material stress or fluid flow, any data is only as good as the engineer’s ability to interpret and apply it.
One of the more important yet difficult calculations to understand is the precise behavior of the breakaway of fluid from walls. However, after five years of research, a team of scientists from MIT, San Diego State University, and United Technologies has developed a breakthrough methodology that allows engineers to precisely determine the location and angle of flow separation in both 2D and 3D as well as steady and unsteady flow conditions.
“Visualization of steady flow vs. unsteady flow can be compared to looking at a static image vs. a movie,” notes Mike Peery, president of TecPlot, Inc. in Bellevue, WA. “The work they did isolates the steady parameters from the craziness of unsteady flow.”
The ramifications of this development are far reaching, from minimizing drag in automobiles to improving cooling of turbine blades (see “Turbine Benefit”), as industries strive for greater energy efficiency and fuel economy.
The Problem
Engineers and scientists have been aware of flow separation for more than 100 years. It started with Ludwig Prandtl’s identification of the phenomenon. Prior to Prandtl’s recognition of the boundary layer in fluid flow around an immersed body, scientists were unclear about the impact of viscosity and friction at the solid surface. Most flow analysis neglected this phenomenon out of necessity, thus adding a large degree of uncertainty to the calculations that would lead to predicting drag. Figure 2 shows the flow about a cylinder under these assumptions.
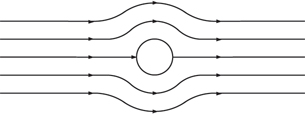 Figure 2: Theoretical Flow Around a Cylinder. |
Note that the flow stream, including velocity, is symmetric about the center of the cylinder. Bernoulli’s Principle suggests that with equal velocities, the pressure distribution at the front of the cylinder must be equal and opposite to the pressure at the rear of the cylinder, thus canceling each other out in the flow direction. Theoretically, there should be no drag on the cylinder in an inviscid flow! Jean le Rond d’Alembert identified the discrepancy between this and experimental results in the mid 18th century but failed to explain it.
Prandtl’s theoretical work on boundary layers, published in 1904, clarified that flow around any solid body consisted of two distinct regions, the boundary layer and free flow. At the surface of the solid, velocity is zero and increases over a small distance to the velocity of the free flow. This transition region is what we now know as the boundary layer. Since the boundary layer is thin, the velocity gradient is high. Newton’s shear stress law then predicts that a large amount of shear stress must be present, creating what is now known as skin friction drag force. This drag force alone does not compensate for the discrepancy identified by d’Alembert.
Prandtl also identified that flow separation was related to the boundary layer behavior. The large shear stresses in the boundary layer, in the presence of increasing pressure, cause the boundary layer to separate from the surface and trail off into the free flow (see Figure 3). When the flow separates from the body, the fragile assumption of balanced pressure is violated. The large pressure region on the leading face of a body in a flow stream is no longer canceled out by the negative pressure at the trailing face and form drag is introduced.
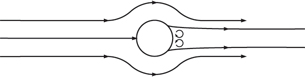 Figure 3: Actual Flow Around a Cylinder with Separation. |
Form drag is usually much larger than the skin friction drag and increases with increasing fluid speed. Consequently, minimizing the pressure differential by reducing or eliminating the area on the trailing face beyond the point of boundary layer separation can have a dramatic effect on the efficiency of a body that travels through a fluid. Applications critically dependent upon this include airplanes, automobiles, boats, and even golf balls. (Hence the dimples!)
The Solution
Aerodynamicists, or any engineer looking to improve the drag on a product, traditionally relied on a wind tunnel to examine the interaction between the body and the fluid. The location at which the flow separates from the body is typically characterized by a transition from laminar flow to turbulent flow. A smoke stream will highlight this transition with swirling or vortex shedding. While the presence of vortex shedding is readily apparent to even the untrained eye, quantifying the location on the body where the flow actually separates is extremely difficult, even for experts.
In conditions of steady flow, where the input stream is time-independent or cyclic, shear stress on the body’s surface can indicate the location of separation as well. Special paints on a body in a wind tunnel can identify changes in shear stress, thus indicating flow separation but they provide no feedback on where the fluid goes when it separates. This is also important for the development of cooling and mixing applications and doesn’t address the more general case of unsteady flow.
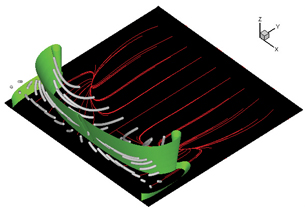 Figure 4: It is now possible to calculate with reasonable precision the exact location of flow separation and to visualize the geometry of its introduction into free flow as a 3D isosurface. |
For about 20 years, practically speaking, engineers have been able to use computers to predict fluid flow using computational fluid dynamics (CFD). This provides many advantages over wind tunnel testing in that variables can be controlled and results can be visualized in a number of graphical means. Moreover, these results can be animated, saved, replayed, and scrutinized at an engineer’s leisure. This flexibility in visualization makes the determination of separation location easier but, as can be seen in Figure 1, which replicates the smoke stream results, it is still imprecise.
“You can see those vortices forming and flipping around and it’s all very pretty but how do you get engineering understanding out of that?” asks Peery.
The Breakthrough
It is now possible to calculate with reasonable precision the exact location of flow separation in certain conditions and to visualize the geometry of its introduction into free flow as a 3D isosurface. Professors George Haller (MIT), Gustaaf Jacobs (San Diego State), Dr. Amit Surana (United Technologies) and their team were able to illustrate this phenomenon with a 3D isosurface to represent the actual computed separation result with the help of Tecplot 360 (see Figure 4).
| Turbune Benefit Gas turbine engines actually run at temperatures well above the melting temperature of the blades for increased efficiency. Engineers use a technique called film cooling so that the blades can operate in this environment. This requires small holes in the blade where compressed air creates a cool film near the surface that keeps it from melting. The flow separation of the boundary layer caused by these jets is one of the limiting factors in how hot a gas turbine can run. If the engineers could truly understand the flow separation in the region of these small jets, the location and pattern of the holes on the blades or the cooling airflow rates can be optimized, greatly improving the efficiency of the engines. |
According to Peery, “Tecplot 360 helps engineers interpret and understand the computed unsteady details in ways that actually are totally profound, different than what anyone has thought before, at least in common knowledge. With the growing computing power available to engineers, the calculation of detailed unsteady results is more commonplace. This creates a need to interpret that data in a way that makes sense.”
Craig Jensen, an industry analyst with ASI USA, believes this helps to address a growing problem in the automotive industry: “The industry needs to move more aerodynamic study into the realm of simulation but lengthy solution times and the inability of engineers to communicate trends has encouraged continued reliance on physical testing. This visualization tool can certainly help to break down that barrier.” Larry Rinek, a business consultant with Frost and Sullivan and a published aviation historian, concurs. “It is important to keep flow attached as far back as possible. A few inches may provide a measurable improvement in fuel economy and CO2 emissions.” Larry also points out that flow separation is a common cause of instability in aircraft.
The fact that these calculations support both steady and unsteady flows should not be overlooked. Prior theory only supported the estimation of flow separation in steady, or predictable and repeating, flow conditions. The determination of a mean isosurface representing flow separation in an unsteady flow condition is unparalleled. Jacobs is quick to point out that the work that his team recently completed is built on significant development of many others in the fluid dynamics field. “Our work rests on the shoulders of hundreds of scientists who have been working on this problem for more than a century,” says Jacobs.
Jacobs also credited the power and flexibility of Tecplot 360 in the development of this breakthrough. He has been using Tecplot software for more than 10 years and believes that its greatest strength is its user friendliness and customization. “The layout files and macro features are particularly useful.” This breakthrough required a visualization component that didn’t exist in commercial software to date. The ability to work within an existing postprocessing, or visualization, framework freed his team to focus on the science, not the user interface.
Peery is quick to note that while he and his company appreciate the opportunity to provide visualization technologies for this study, the focus must lie with Haller, Jacobs, Surana, and the research. “Our understanding of flow separation has just taken a big leap forward.”
The methodology uses high-order Navier-Stokes equations, the backbone of all modern CFD calculations. The solution expressly addresses behavior in the boundary layer.
According to Jacobs, “The lower-order methods employed by most commercial CFD codes are efficient for general flow results but may have trouble getting accurate results in the boundary layer.” More precision was required to fully understand separation. Jacobs suggests it may be a few years before commercial applications incorporate this research. However, demand from the engineering community will ultimately drive leading CFD providers to this and other ways to improve understanding of increasingly complex data.
More Info:
ASI USA
Bingham Farms, MI
Tecplot, Inc.
Bellevue, WA
Vince Adams has been working, writing, and teaching in the field of simulation for 20 years. He is the co-author of 3 books and numerous articles on FEA and design analysis. He can be reached for questions or comments at [email protected]. Comments should be sent to [email protected].
Subscribe to our FREE magazine, FREE email newsletters or both!
Latest News
About the Author
DE’s editors contribute news and new product announcements to Digital Engineering.
Press releases may be sent to them via [email protected].


