Visualizing Data: Illustrating Complex Quantum Matter Principles

Latest News
July 15, 2016
By Dr. Robert Green, postdoctoral fellow, Quantum Matter Institute
In the field of quantum matter research, we seek to uncover materials with properties that may find applications in new technologies. My team and I study the properties of various materials at an atomic level to find innovative ways that they can be used to compose the next generation of computer chips. Our research results in large amounts of experimental data. One of the toughest challenges is to analyze and present the data in a meaningful way, for not only our understanding of their underlying complex, quantum principles, but also for wider audiences, including fellow researchers in the field.
Examining the Challenge
One of our key research projects aims to uncover properties in materials that might be used to make smaller, more energy efficient computer chips—five to 10 years from now. In accordance with Moore’s Law, the number of transistors and overall processing power within a chip has doubled every two years for over four decades. But as chips have become more and more powerful, technological demands also continue to expand and the devices that use these chips are also becoming more portable. As a result, conventional practices of making chips are straining the laws of physics to incorporate more transistors within a shrinking area.
Due to the fundamental limits of conventional chip production, the semiconductor industry’s rate of innovation is plateauing and Moore’s Law is in its final days. To meet the computing needs of today and the future, we as scientists must look for new ways to continue the progression towards more energy efficient chips that provide even greater processing power.
Conventional computer chips are produced by photolithography, where an ultraviolet light is projected to etch a geometric pattern on a silicon wafer for integrating wires, transistors and other components. To build smaller chips, some manufacturers are looking toward new technologies such as immersion lithography, which uses water to bend light waves for finer detailing to allow for more components within a given area. Many manufacturers, like Intel, are turning to multiple-pattern lithography, which employs multiple etch layers “stacked” upon each other for greater feature density while keeping the chip size small. Others are turning to spintronics, a technology that uses the magnetic property of electrons, specifically their “spin,” to store and manipulate digital information. While typical silicon chips rely on electrical properties, spintronics harnesses both magnetic and electrical properties with the promise of more robust, low-energy computing.
In our project, my team and I examined how certain materials conduct electricity and emit or absorb light, which would be conducive to smaller chip manufacturing, because electronics that incorporate light, or “optoelectronics,” such as LEDs in laptops and tablets, will continue to be prevalent in the coming years. But as stated above, the experiments carried out during this project produced a large amount of raw data. Rather than attempt the impossible task of interpreting this raw data from X-ray and optical measurements directly, we needed to process the data in some way for us to extract the pertinent quantum matter information.
Visualizing Experimental Data
Advanced data analysis and graphing software helps to visualize experimental data to better understand their underlying abstract principles. Whether it is scaling the data, taking the derivative, or fitting various functions to the data, these solutions make it easy to find the most intuitive way to present and analyze the results. In our research, we use Origin by OriginLab, a comprehensive software solution for scientists and engineers at every technical level to professionally graph gathered data. It has proven to be crucial for presenting our research through publication-quality graphs, and fostered streamlined analysis and collaboration with fellow researchers.
For example, in Fig. 1 we looked at the potential use of silica glass (SiO2) embedded with Manganese (Mn) and Cobalt (Co) atoms in optoelectronic applications. We wanted to examine changes in the optical properties of the samples based on varying doses, high (H), medium (M) and low (L), of Mn and Co by plotting data on luminescence. There were peaks in the data that we wanted to fit functions to in order to determine their intensities and central energy values. We were able to use Origin’s standard Gaussian line fitting to fit all of our different datasets and extract the centers and intensities of the different doses’ peaks. Origin’s “Add Inset Graph” feature was also useful to delve deeper and present trends in the analysis results, as shown within Fig. 1. Instead of our team having to decipher mountains of data, Origin made the information visual and easy to interpret.
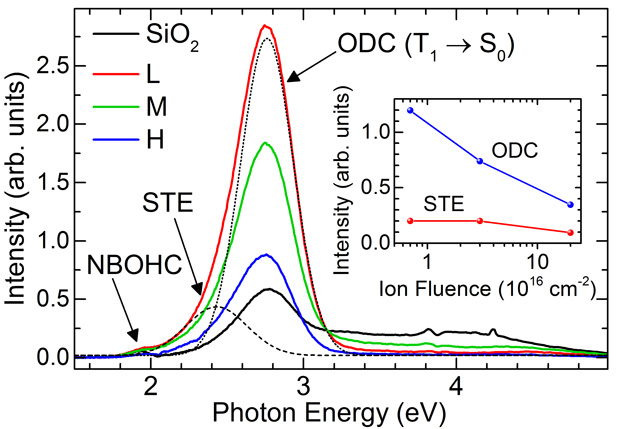 The potential use of silica glass embedded with Manganese and Cobalt atoms in optoelectronic applications.
Streamlining Data Analysis and Reporting
We were able to easily compare data results through Origin’s multiple panel graph representation feature, which allows users to stack multiple graphs on a single pane. For example, Fig. 2 depicts contour plots that present the change in electronic properties between samples with different amounts of atomic implants and no implants as a control. The first graph shows curves for samples with varying doses of Mn and Co, and the black curve represents the control. The bottom graphs illustrate energy emission and absorption between the samples, labeled by XES and XAS, respectively. Stacking the plots made it easier to visually identify the subtle differences between their electrical and optical properties that would have been daunting by simply looking at spreadsheets of measurements.
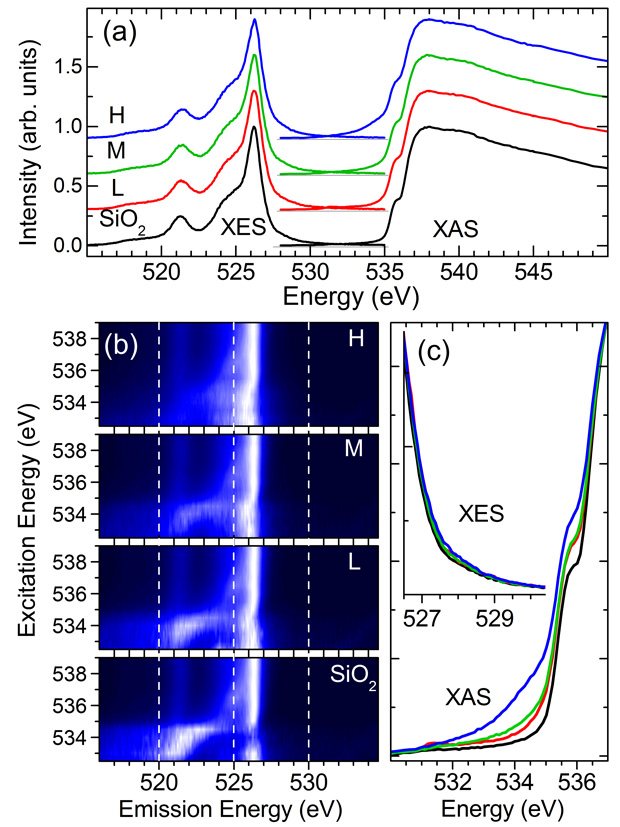 Contour plots that present the change in electronic properties between samples.
Advanced data analysis and graphing software like Origin also possess time saving functionalities that help facilitate analysis and reporting. Origin’s analysis templates and batch processing features allowed us to pre-configure analysis processes and report generation prior to importing additional large datasets. Each new batch of data automatically underwent the same processes and we no longer had to continuously recreate reports, thereby allowing us to speed up data analysis.
Foster Collaboration with Fellow Researchers
Origin offers a unique benefit of enabling users to share Origin data and graphs with other researchers with Origin Viewer, its standalone application that allows viewing and copying of information from Origin project files even without having Origin installed. Colleagues can directly run Origin Viewer and open Origin project files, accessing the data, graphs and analysis results provided by the user. And because the information has been processed and is easier to follow, broad collaboration is possible, which both benefits the current experiment as well as future research that builds on the published data.
In retrospect, although the experiments our group carries out involve vast datasets and complex, quantum matter principles, advanced graphing software makes them more comprehendible for our understanding and analysis. Equipped with a variety of functions and tools like those offered by Origin, we have the ability to visualize experimental data in a concise and coherent manner that far exceeds spreadsheets and is much more ideal for sharing our findings with fellow researchers via publications and industry conferences. Data analysis and graphing software will continue to help illustrate the complexities of our quantum matter research towards the development of smaller, faster computer chips.
Robert Green, Ph.D., is a postdoctoral research fellow at the Quantum Matter Institute of the University of British Columbia. He can be reached by email at [email protected].
Subscribe to our FREE magazine, FREE email newsletters or both!
Latest News


