

Latest News
April 1, 2011
Visual data management offers greater insight to projects.
Allen Gager frequently goes hunting. He doesn’t use a crossbow or a shotgun; instead, he fires up Autodesk Inventor. He’s looking for what he calls “wild files,” nesting somewhere deep within the assembly trees of his design files.
“We have a lot of data in (Autodesk Vault) that came from somewhere out in the wild,” says Gager, a mechanical engineer for the global packing machine manufacturer KHS. “Basically the files were distributed across network drives. They’re now in a single managed repository.”
Many of these wild files have dubious provenance, with undetermined revision histories. “For example, everything housed in Vault (the data-management system for Inventor users) is now revision-controlled at the file level,” he says. “But because there was no good way to manage revisions previously, Vault couldn’t determine the revision level of some imported data.”
Addressing those files via traditional means would involve:
- Identifying them in the data management software to obtain their part numbers.
- Opening the assembly files where they’re embedded in the CAD program to inspect them.
- Declaring them safe to use in the data management system or fixing them in the CAD program.
“One of the things that (Autodesk Vault’s) visual data mapping allows us to do is to quickly single out files that are not compliant,” says Gager. “This lets me see which files are not, and then I can determine which have the proper revision, or which need more investigation.”
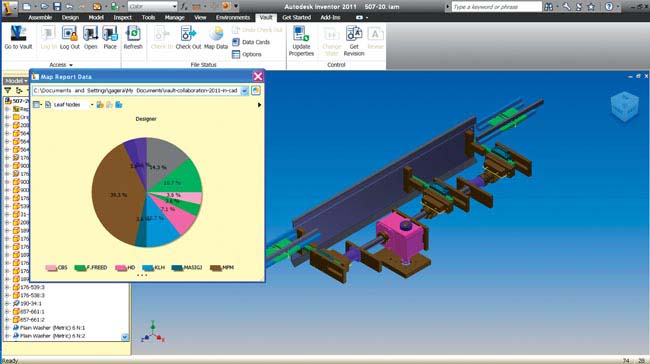 The use of data mapping with Autodesk Vault lets engineers from packaging equipment manufacturer KHS to display different part clusters based on their attributes. |
Visual data mapping in Autodesk Vault lets you use part properties as filters and display different classes as color-coded clusters, right from the CAD modeling environment. A similar approach has been proposed by Siemens PLM Software, under the name HD PLM. It displays product data housed in TeamCenter data-management software within 3D assembly models constructed in NX. A significant departure from data-management solutions constructed in rows and columns, visual data management might yield new insights previously unavailable.
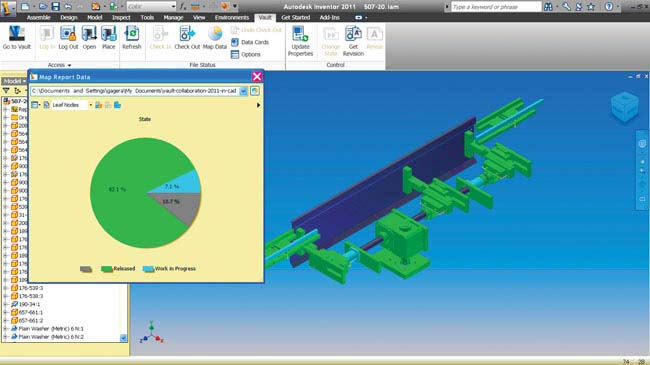 Using Autodesk Vault’s data mapping, KHS identifies parts that have been released, and those that are in progress. |
Visual Vault
Last April, Autodesk gave members of the trade press an early look at Autodesk Vault’s visual data mapping, set to become part of Autodesk Vault 2011. Want to see which parts are overdue? Which ones are from overseas subcontractors? How about parts that have passed QA check? Whatever you’d like to see, you’ll be able to display it right in your CAD modeling environment, Autodesk Inventor. Even though the data associated with each part—part number, check-in/check-out dates, ownership, revision history, and other properties—is stored and managed in the data-management environment, the CAD program becomes the environment to query, retrieve, filter, and view the data.
“I no longer have to manage my CAD data in a spreadsheet like an accountant, I don’t have to focus on rows of data,” says Gager. “(In Vault’s data mapping), I can see the graphical picture, in the colors that are pleasing to me, right in my CAD model.”
Color displays in Vault are not permanent designations in your CAD files. They’re simply a method for you to quickly isolate and view parts with selected characteristics (for example, parts that have not been stress-tested or parts that are currently checked out). So, for project managers like Gager, the visual display is intuitive and reduces complexity to modeling workload.
“We offer our engineers flexibility, because individuals see colors differently,” explains Gager. “The mapping technology uses a report that’s easily configurable (in Vault). So I can set up the report, and let everyone see parts in the same color (for instance, blue for all parts that are checked out). My engineers may also see the data they want to see, in the manner they want to see it. In that case, it doesn’t have an effect on anybody else.”
For instance, Gager may choose to view all files below Revision B in Yellow, whereas a colleague of his may choose to view them in Red. If you prefer consistency, however, you may do what Gager is considering: Set up report templates so that there is company-wide agreement on what each color means.
From Data Overload to Filtered Views
Because most data management tools are designed for use by everyone, very few of them are designed for anyone in particular. Therefore, no matter what your priority is, you must sift through dozens of—or, in some cases, hundreds of—data fields to identify the ones you need. It is—and still remains—a major source of frustration for those who are forced to work within the confines of a rigid data management system. The configurable environment in Autodesk Vault, along with its graphical approach, is expected to make data-filtering a lot simpler.
Gager, for instance, is involved in identifying imported files and then migrating them into the “trusted” category. Consequently, when he opens assembly models, he’s only interested in parts marked “wild files” and those marked “trusted.” Promoting wild files to the “trusted” class after verification is as simple as right-clicking and changing its categorization—no need to launch a separate data-management program window.
By contrast, Gager’s colleagues who are responsible for developing a new design might be more interested in parts manufactured in-house or parts from a certain vendor. Those in purchasing and acquisition may be more interested in cost. Whatever the desired fields, each user can isolate, view, and perform maintenance operations on them as a group, without paying attention to unconcerned fields.
“Any property you track in Vault can be used for visual mapping,” says Gager. “If you have 1,500 parts, and five of them are classified ‘wild,’ I can just say, ‘Show me those in Red.’”
At KHS, Gager and his colleagues often use visual data mapping to identify files checked out to themselves and files checked out to others, treating Vault as “a traffic cop, and providing true collaboration,” according to Gager.
High-Definition Product Lifecycle
Siemens PLM Software first introduced HD PLM in November 2009, in a video clip that highlighted the possibility of using its NX CAD program to search, retrieve, and display product lifecycle data housed in TeamCenter.
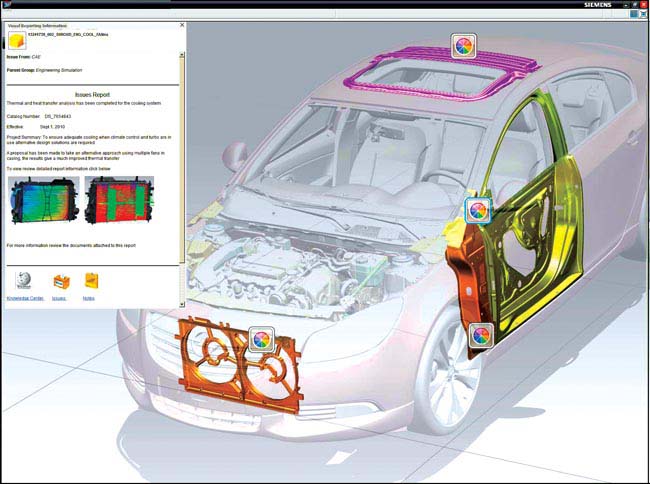 Siemens PLM Software’s HD PLM concept, implemented via NX and Teamcenter, lets you display parts with draft angles. Each button is clickable, with additional info on the issues associated with the individual part. |
“It’s not a prerequisite that you need to have both NX and TeamCenter to take advantage of HD PLM,” said Paul Brown, Siemens’ senior marketing director of NX, in an interview at Siemens PLM Connection 2010 conference. “But the force multiplier is much bigger if you have both … You can just use NX data, NX attributes, but the scale of what you can report on, what you can drill into is a lot smaller.”
All the data housed in NX and TeamCenter are “HD-ready,” as Brown puts it. “You don’t need a separate file format, you don’t need translation.” If you’d like to use data from other PLM systems or ERP systems with NX in a similar fashion, however, you may need to do some additional integration work.
Many of us used to receive useful location data, such as bus stops and restaurants, in text. The information was there, right in your phone book, but you had to plot them out on a map in your own time. Then came online mapping applications, ushering in a whole new way of navigation.
The automatic correlation between CAD and data-management systems is a similar watershed moment, unleashing new ways of understanding projects and products. In the PLM industry, some are fond of saying, “PLM’s biggest competition is Excel.” For years, the spreadsheet was a good-enough tool for homegrown data management. But the emerging breed of visual-data management tools, as exemplified by Autodesk Vault’s data mapping and Siemens PLM Software’s HD PLM, suggests data-management is finally breaking out of its mold.
More Info:
Subscribe to our FREE magazine, FREE email newsletters or both!
Latest News
About the Author
Kenneth Wong is Digital Engineering’s resident blogger and senior editor. Email him at [email protected] or share your thoughts on this article at digitaleng.news/facebook.
Follow DE

